Inateck FE2010 and UA1001 SATA – USB 3.0 Storage Bridges Review
Storage bridges come in many varieties within the internal and external market segments. On the external side, they usually have one or more downstream SATA ports. The most popular uplink port is some sort of USB connection. eSATA as an uplink interface is on the way out. High-end products have Thunderbolt support. Within the USB storage bridge market, device vendors have multiple opportunities to tune their product design for specific use-cases.
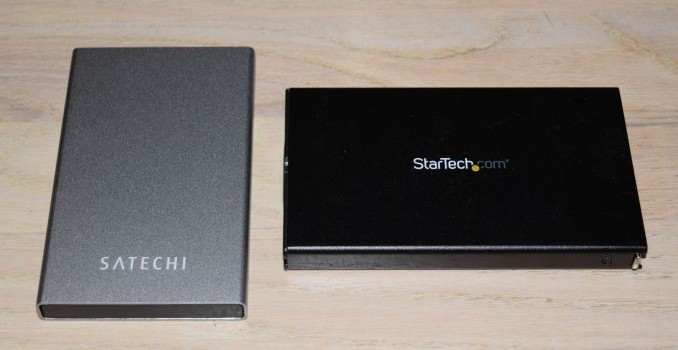
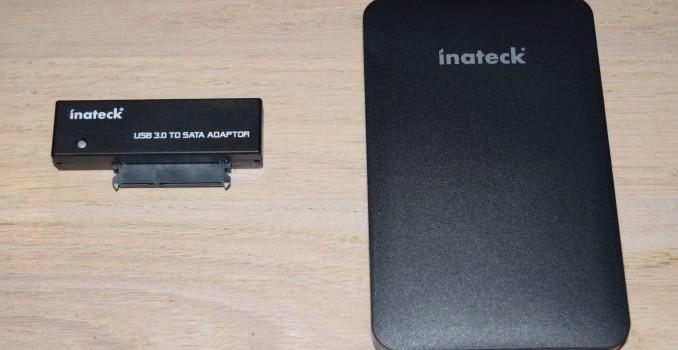
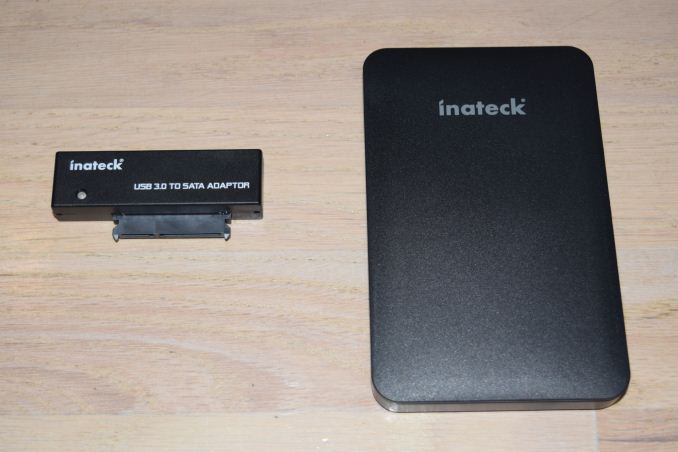
Today’s review will take a look at two bridges from Inateck, the FE2010 and the UA1001. The common characteristic is that both of them present a SATA port at one end and a USB 3.0 Micro-B at the other. However, the use-cases are completely different. While the FE2010 is an enclosure for a 2.5″ drive and can operate only via bus power, the UA1001 is a SATA adaptor meant for use with high-power SATA devices such as 3.5″ drives and optical drives. The UA1001 can operate with just the bus power for 2.5″ drives. For other use-cases, it utilizes a bundled 24W power adapter. We utilized it in the latter mode in our review of the Seagate BarraCuda Pro 10TB helium drive.
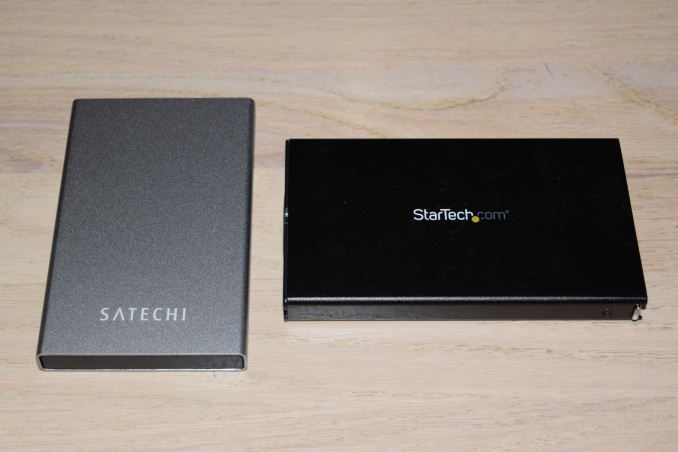
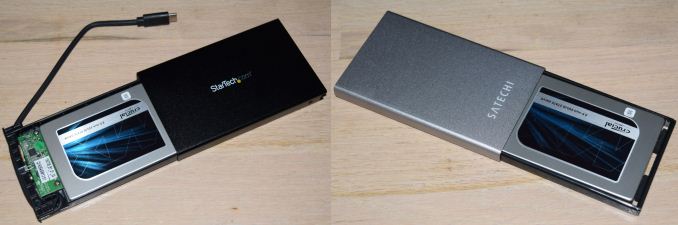
The FE2010 is a tool-less design, allowing part of the rear to slide off in order to insert a 2.5″ drive into the enclosure’s SATA port. A small foam pad is also included in order to ensure that internal drive is held snugly within the enclosure. The gallery below shows that the FE2010 has an explicitly on/off switch and an activity LED. Internally, the unit uses a JMicron JMS578 bridge chip with UASP support. The firmware is configured to power down the SATA drive after 30 minutes of inactivity. The enclosure itself is made of ABS plastic and looks sturdy. However, because of its lightweight nature, it does feel a bit flimsy in the hand. The UA1001 is meant for use by consumers wishing to swap out SATA drives often. To that end, it advertises hot-plug capability and features an exposed SATA port. The ASMedia ASM1153E bridge chip is used in this product.


Consumers need to keep the following aspects in mind for external storage devices / enclosures with a USB interface:
- Support for UASP (USB-attached SCSI protocol) for better performance (reduced protocol overhead and support for SATA Native Command Queueing (NCQ))
- Support for TRIM to ensure SSDs in the external enclosure can operate optimally in the long run
- Support for S.M.A.R.T passthrough to enable monitoring of the internal SATA device by the host OS
The table below presents the detailed specifications and miscellaneous aspects of the units and how they compare.
| Comparative Storage Bridges Configurations | ||
| Aspect | Inateck FE2010Inateck UA1001StarTech.com S251BU31C3CBSatechi B01FWT2N3K | Inateck UA1001StarTech.com S251BU31C3CBSatechi B01FWT2N3KInateck FE2010 |
| Downstream Port | 1x SATA III | 1x SATA III |
| Upstream Port | USB 3.0 Micro-B | USB 3.0 Micro-B |
| Bridge Chip | JMicron JMS578 | ASMedia ASM1153E |
| Power | Bus Powered | 24 W (12 V @ 2 A) Wall Wart with 135 cm Cable |
| Use Case | Tool-free 2.5″ HDD/SSD Enclosure (up to 9 mm height) | Bare USB 3.0 to SATA Adaptor for 2.5″ / 3.5″ Drives and Optical Drives |
| Physical Dimensions | 130 mm x 82 mm x 14 mm | 70 mm x 30 mm x 12 mm |
| Weight (diskless) | 87 grams (with cable) | 16 grams (adapter only) 73 grams (with cable) 228 grams (with power adapter & cable) |
| Cable | 30 cm USV 3.0 Micro-B to USB 3.0 Type-A | 110 cm USB 3.0 Micro-B to USB 3.0 Type-A |
| S.M.A.R.T Passthrough | Yes | Yes |
| UASP Support | Yes | No |
| TRIM Passthrough | Yes | No |
| Price | USD 15 | USD 22 |
| Review Link | Inateck FE2010 Review | Inateck UA1001 Review |
Our evaluation routine for storage bridges borrows heavily from the testing methodology for direct-attached storage devices. The testbed hardware is reused. CrystalDiskMark is used for a quick overview, as it helps determine availability of UASP support and provides some performance numbers under ideal scenarios. Real-world performance testing is done with our custom test suite involving robocopy benchmarks and PCMark 8’s storage bench.
Performance Benchmarks
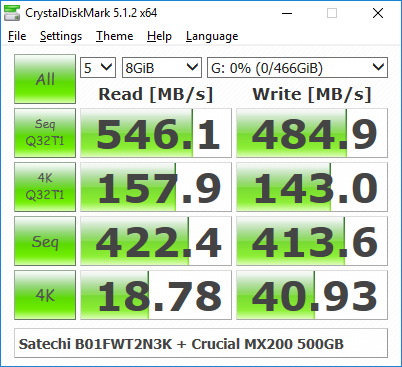
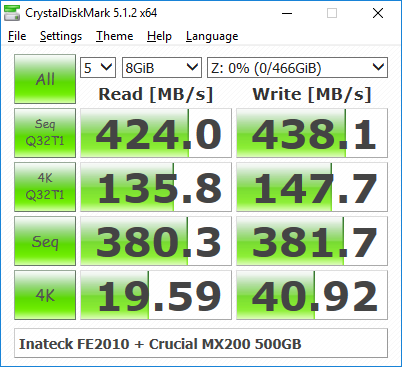
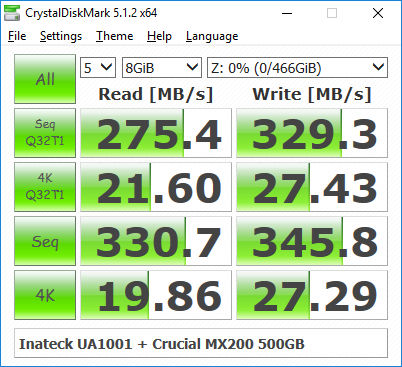
CrystalDiskMark uses four different access traces for reads and writes over a configurable region size. Two of the traces are sequential accesses, while two are 4K rando accesses. Internally, CrystalDiskMark uses the Microsoft DiskSpd storage testing tool. The ‘Seq Q32T1’ sequential traces use 128K block size with a queue depth of 32 from a single thread, while the ‘4K Q32T1’ ones do random 4K accesses with the same queue and thread configurations. The plain ‘Seq’ traces use a 1MiB block size. The plain ‘4K’ ones are similar to the ‘4K Q32T1’ except that only a single queue and single thread are used.
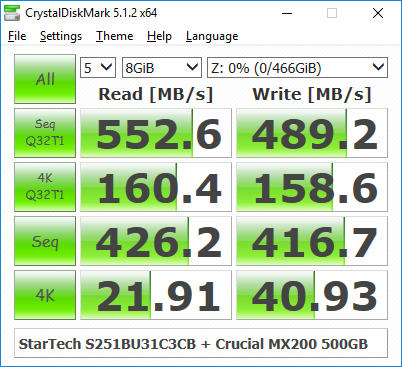
Comparing the ‘4K Q32T1’ and ‘4K’ numbers can quickly tell us whether the storage device supports NCQ (native command queuing) / UASP (USB-attached SCSI protocol). If the numbers for the two access traces are in the same ballpark, NCQ / UASP is not supported. This assumes that the host port / drivers on the PC support UASP. We can see that the FE2010 performs way better than the UA1001 while using the same SSD. It also has UASP support (with NCQ). That said, the use-case for UA1001 is more ith 3.5″ hard drives and other slower SATA devices. But, it is good to keep this mind while trying to transfer data to/from spare SSDs using the UA1001.
| Storage Bridge Benchmarks – CrystalDiskMark | ||
| Inateck FE2010Inateck UA1001StarTech.com S251BU31C3CBSatechi B01FWT2N3K | Inateck UA1001StarTech.com S251BU31C3CBSatechi B01FWT2N3KInateck FE2010 | |
 |
 |
|
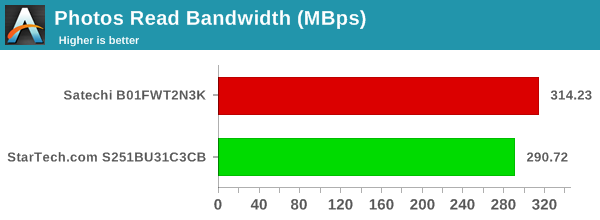
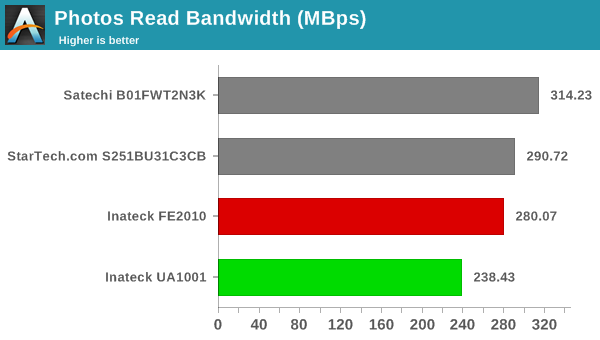
Moving on to the real-world benchmarks, we first look at the results from our custom robocopy test. In this test, we transfer three folders with the following characteristics.
- Photos: 15.6 GB collection of 4320 photos (RAW as well as JPEGs) in 61 sub-folders
- Videos: 16.1 GB collection of 244 videos (MP4 as well as MOVs) in 6 sub-folders
- BR: 10.7 GB Blu-ray folder structure of the IDT Benchmark Blu-ray (the same that we use in our robocopy tests for NAS systems)
The test starts off with the Photos folder in a RAM drive in the testbed. robocopy is used with default arguments to mirror it onto the storage drive under test. The content on the RAM drive is then deleted. robocopy is again used to transfer the content, but, from the storage drive under test to the RAM drive. The first segment gives the write speed, while the second one gives the read speed for the storage device. The segments end with the purge of the contents from the storage device. This process is repeated thrice and the average of all the runs is recorded as the performance number. The same procedure is adopted for the Videos and the BR folders. The resuts roughly track what we observed in the CrystalDiskMark benchmark numbers. Readers interested in looking at all the graphs in one shot can choose the ‘Expand All’ option in the dropdown menu.
);Photos ReadPhotos WriteVideos ReadVideos WriteBlu-ray Folder ReadBlu-ray Folder WriteExpand All
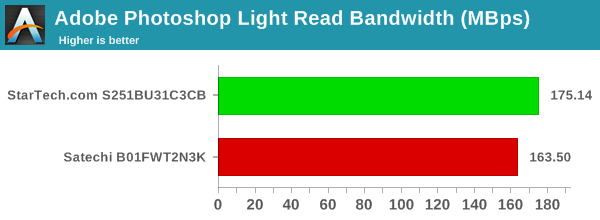
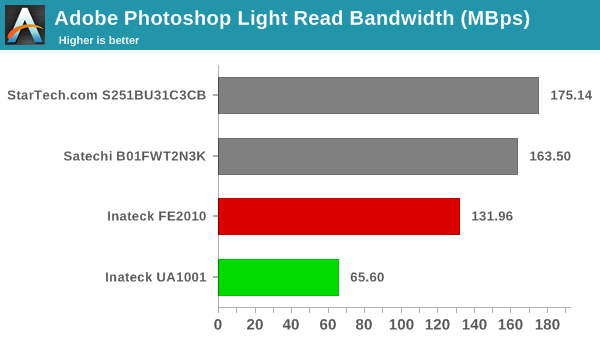
High-performance external storage devices can also be used for editing multimedia files directly off the unit. They can also be used as OS-to-go boot drives. Evaluation of this aspect is done using PCMark 8’s storage bench. The storage workload involves games as well as multimedia editing applications. The command line version allows us to cherry-pick storage traces to run on a target drive. We chose the following traces.
- Adobe Photoshop (Light)
- Adobe Photoshop (Heavy)
- Adobe After Effects
- Adobe Illustrator
Usually, PC Mark 8 reports time to complete the trace, but the detailed log report has the read and write bandwidth figures which we present in our performance tables. Note that the bandwidth number reported in the results don’t involve idle time compression. Results might appear low, but that is part of the workload characteristic. Note that the same CPU is being used for all configurations. Therefore, comparing the numbers for each trace should be possible across different DAS units. Readers interested in looking at all the graphs in one shot can choose the ‘Expand All’ option in the dropdown menu.
);Adobe Photoshop Light ReadAdobe Photoshop Heavy ReadAdobe After Effects ReadAdobe Illustrator ReadAdobe Photoshop Light WriteAdobe Photoshop Heavy WriteAdobe After Effects WriteAdobe Illustrator WriteExpand All
Thermal Aspects and Power Consumption
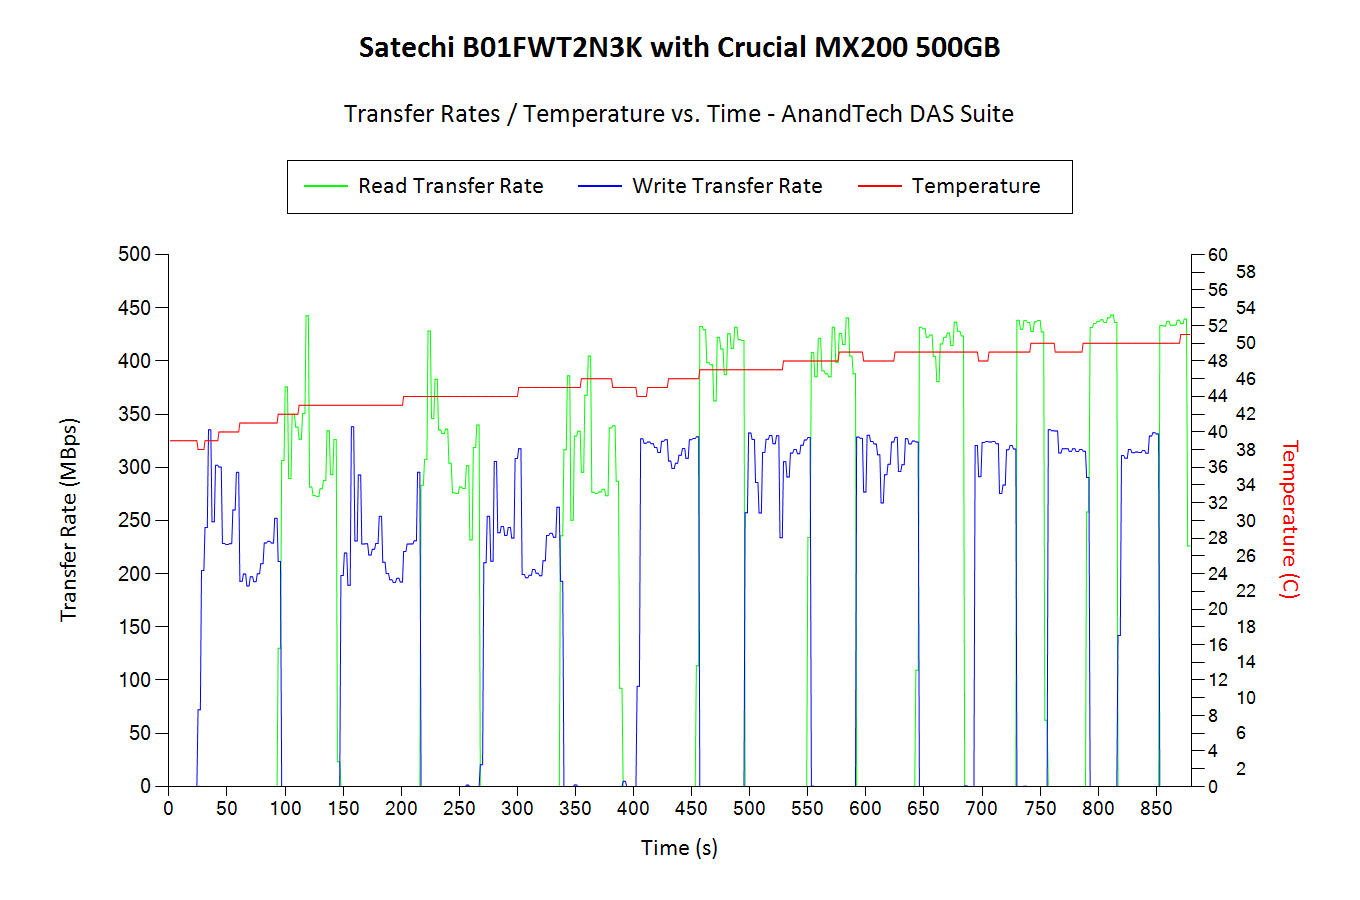
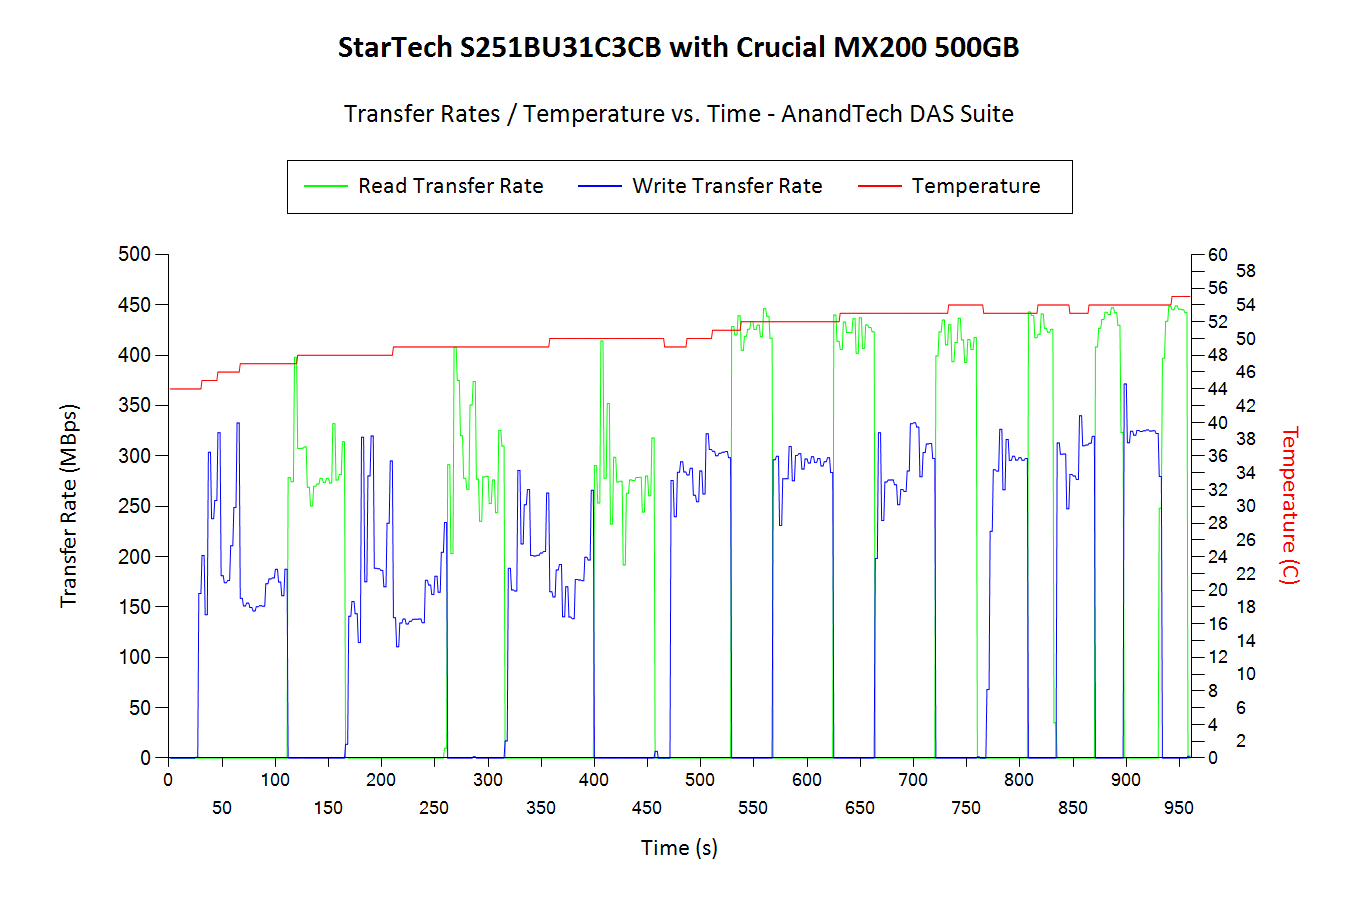
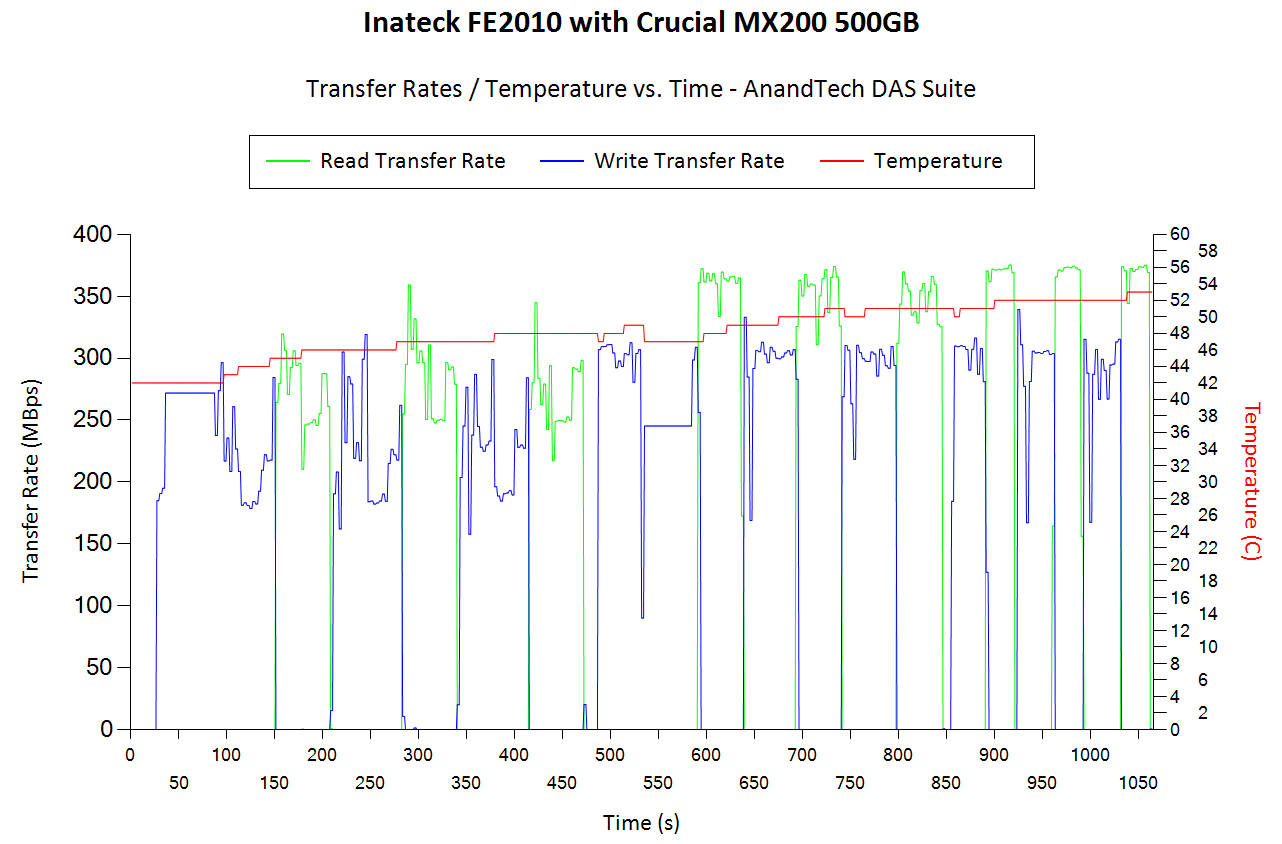
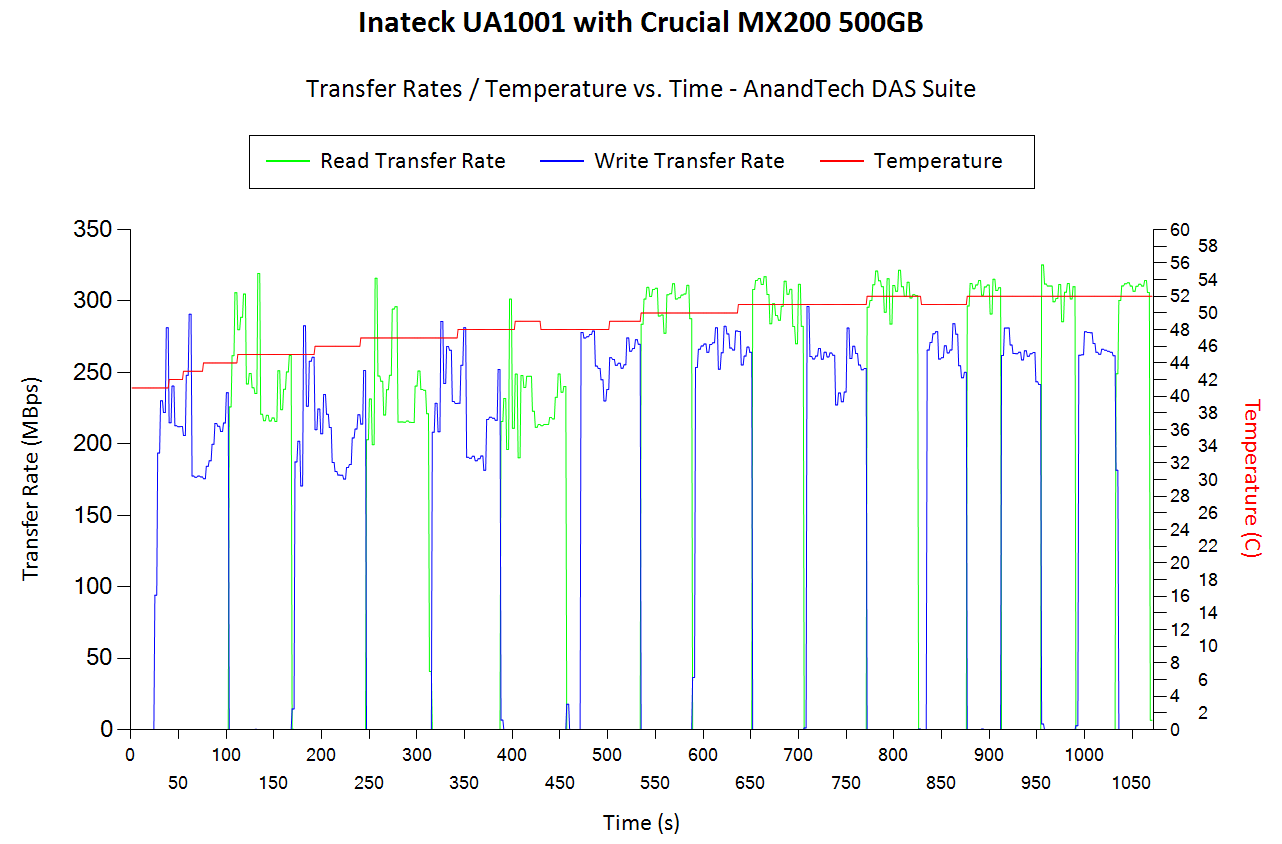
The thermal design of external storage enclosures has now come into focus, as high-speed SSDs and interfaces such as USB 3.1 Gen 2 can easily drive up temperatures. This aspect is an important one, as the last thing that users want to see when copying over, say, 100 GB of data to the drive inside the enclosure, is the transfer rate going to USB 2.0 speeds. In order to identify the effectiveness with which the enclosure can take away heat from the internal drive, we instrumented our robocopy DAS benchmark suite to record various parameters while the robocopy process took place in the background. Internal temperatures can only be gathered for enclosures that support S.M.A.R.T passthrough. Readers can click on the graphs below to view the full-sized version. The UA1001 is an open-air design and relies just on the thermal design of the drive itself. However, the FE2010 puts the target drive in an enclosed space. In our evaluation, the temperature of the drive inside the FE2010 ended up just a little bit above the UA1001. However, neither bridge has problems with thermal throttling of the installed drive.
| Storage Enclosure Thermal Characteristics | ||
| Inateck FE2010Inateck UA1001StarTech.com S251BU31C3CBSatechi B01FWT2N3K | Inateck UA1001StarTech.com S251BU31C3CBSatechi B01FWT2N3KInateck FE2010 | |
 |
 |
|
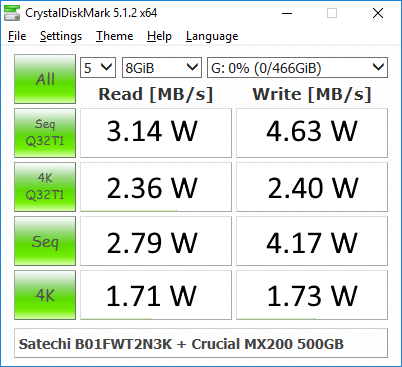
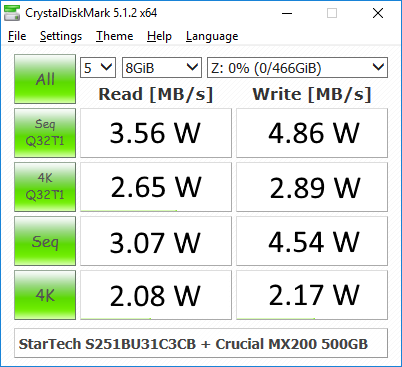
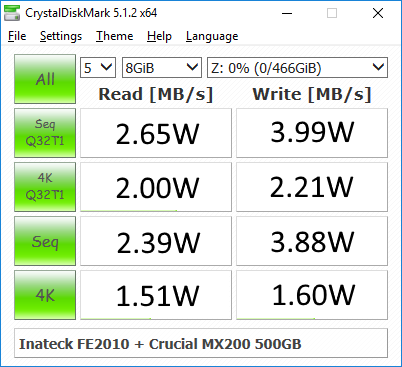
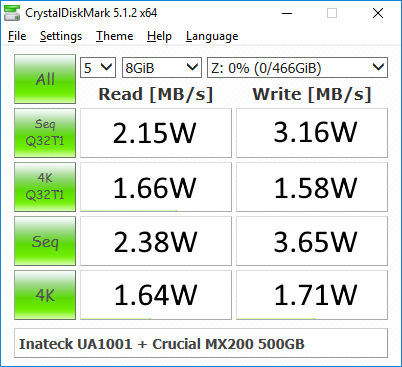
It is challenging to isolate the power consumption of the storage bridge alone while treating the unit as a black box. In order to study this aspect in a comparative manner, we use the same SSDs (Curcial MX200 500GB) in the units and process the same workloads on them (CrystalDiskMark 5.1.2’s benchmark traces with a region size of 8GB and the number of repetitions set to 5). Plugable’s USBC-TKEY power delivery sniffer was placed between the host PC and the storage bridge to record the power consumption. The average power consumption for each access trace was recorded. The pictures below present the numbers in a compact and easy to compare manner.
| Power Consumption – CrystalDiskMark | ||
| Inateck FE2010Inateck UA1001StarTech.com S251BU31C3CBSatechi B01FWT2N3K | Inateck UA1001StarTech.com S251BU31C3CBSatechi B01FWT2N3KInateck FE2010 | |
 |
 |
|
Any difference in power consumption for the same access trace between two different units is down to the storage bridge itself (since the drive used is the same in all cases). The UASP-enabled JMS578 consumes more power during traffic compared to the ASM1153E for most access traces. Only the 4K random accesses seems to stress the UA1001 more.
Miscellaneous Aspects and Concluding Remarks
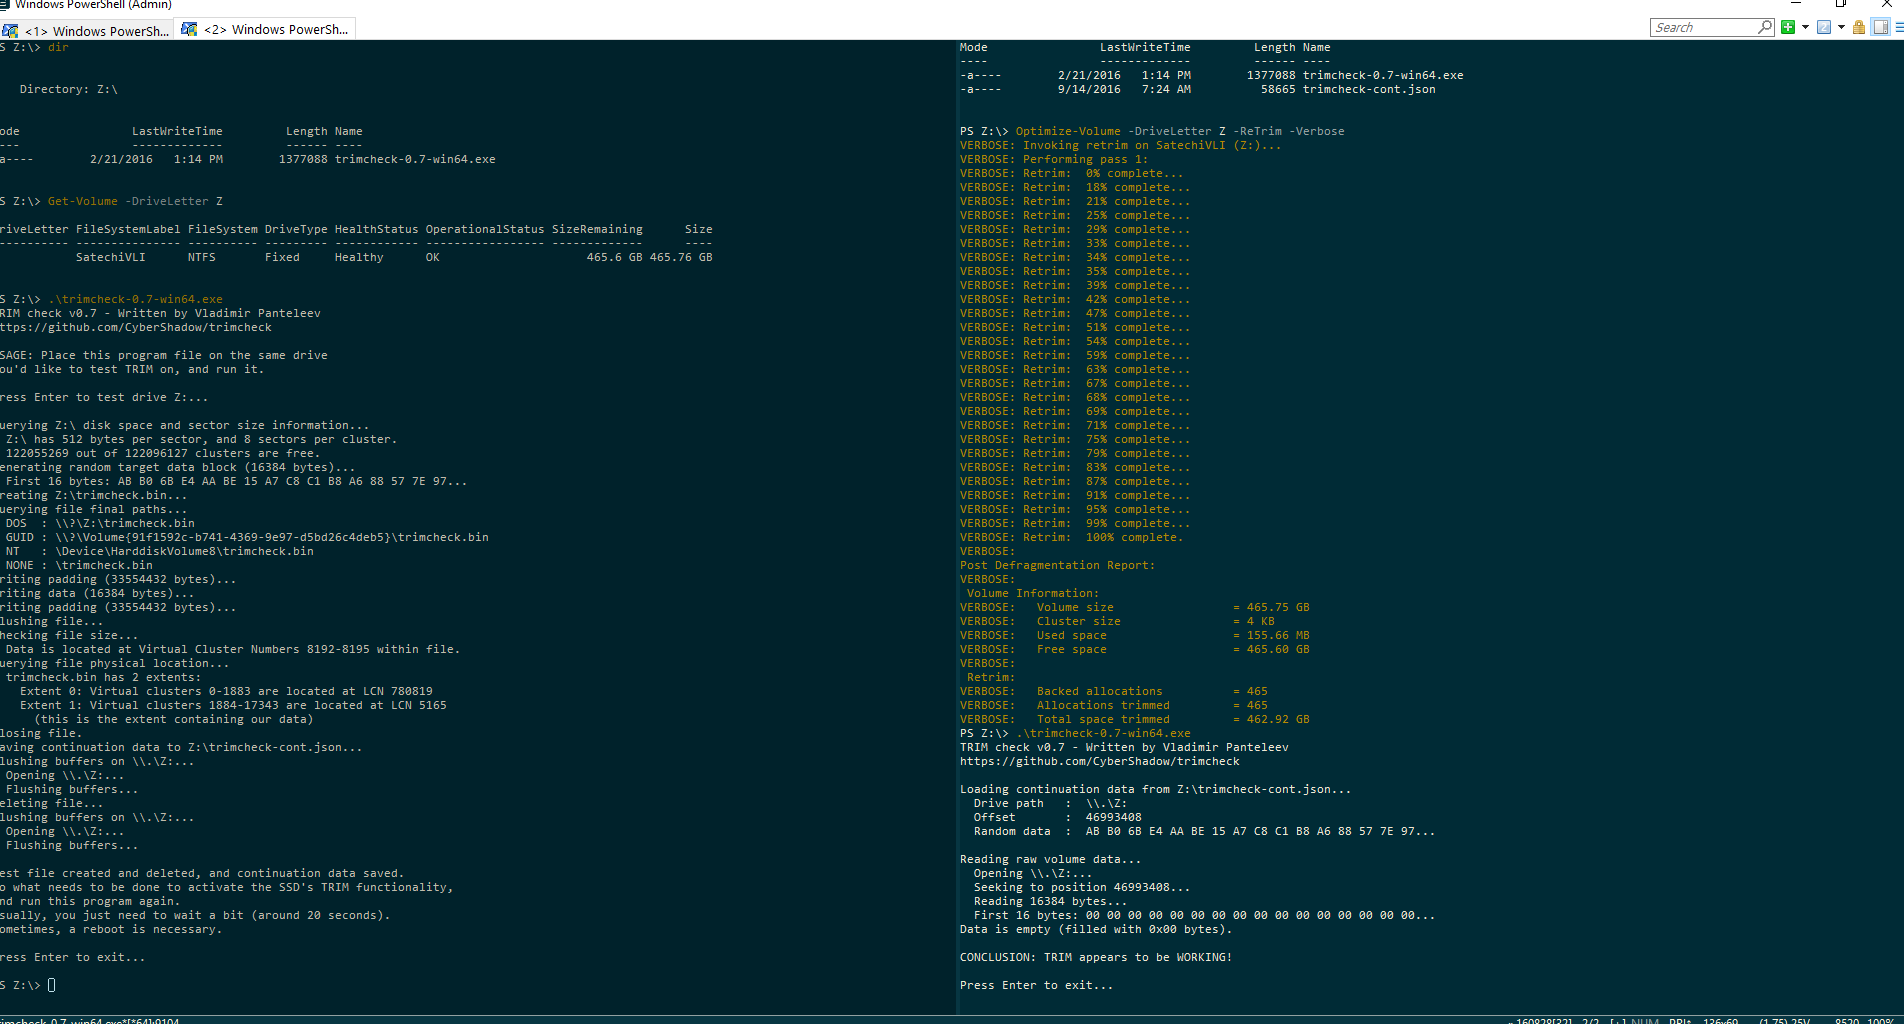
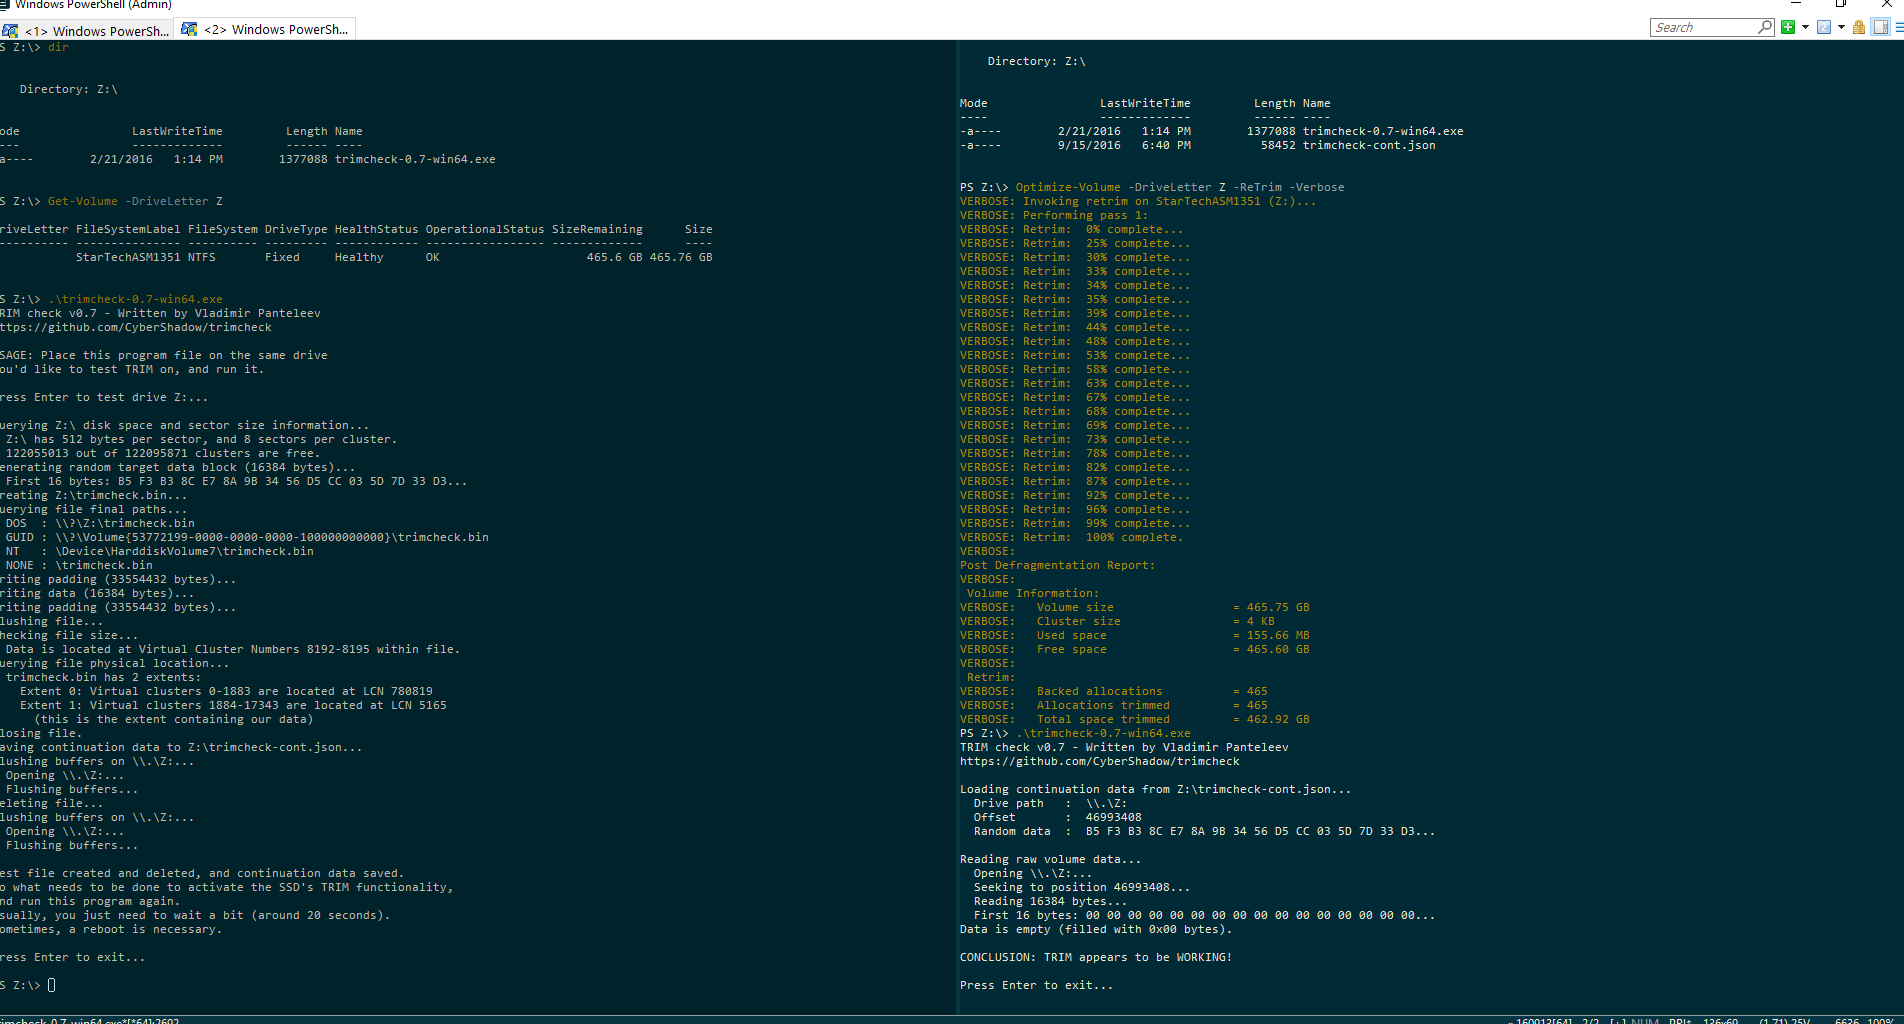
Storage bridges that support UASP fully can translate the SCSI UNMAP command to TRIM commands for SSDs connected to the downstream port. Checking for TRIM support has been a bit tricky so far. CyberShadow’s trimcheck is a quick tool to get the status of TRIM support. However, it presents a couple of challenges: it sometimes returns INDETERMINATE after processing, and, in case TRIM comes back as NOT WORKING or not kicked in yet, it is not clear whether the blame lies with the OS / file system or the storage controller / bridge chip or the SSD itself. In order to get a clear idea, our TRIM check routine adopts the following strategy:
- Format the SSD in NTFS
- Load the trimcheck program into it and execute
- Use the PowerShell command Optimize-Volume -DriveLetter Z -ReTrim -Verbose (assuming that the drive connected to the storage bridge is mounted with the drive letter Z)
- Re-execute trimcheck to determine status report
Conclusions can be made based on the results from the last two steps.

The FE2010 with the JMicron JMS578 bridge chip supports TRIM passthrough, as proved above.
On the other hand, the UA1001 with the ASM1153E bridge chip doesn’t support TRIM passthrough – Windows reports that the optimization operation is not permitted by the hardware backing the volume.

Coming to the business end of the review, we find that the Inateck FE2010 and UA1001 target different use-cases. The UA1001 is the more versatile of the two (with support for a wide variety of SATA devices), but loses out to the FE2010 when it comes to features targeting SSDs (such as UASP support and TRIM passthrough). Both of them are reasonably priced – the UA1001 is currently $22 on Amazon, while the FE2010 is just $15. The UA1001 is priced higher due to the bundled power adapter.
The FE2010 can be recommended for its performance and features targeting SSDs. However, we did have some trouble with the initial firmware on the unit. While running CrystalDiskMark’s access traces at higher queue depths, the unit would just freeze up. This could be reproduced only when the FE2010 was connected to a USB port with the Intel Alpine Ridge controller behind it. Though I was unable to reproduce the issue with any other USB port (even on the same PC), the problem had been reported by at least one other customer with a different board. Inateck’s customer support delivered a firmware update after being able to reproduce the issue at their end. The new firmware managed to help the FE2010 complete our full benchmark routine without hanging. However, the unit still had uncomfortably long pauses in certain write segments of our robocopy benchmarks (drive activity pegged at 100%, but no data transfer at all in the Task Manager’s Performance tab for the disk). The pause is reflected in the flat lines in the performance consistency graphs presented in the previous sub-section (the zero transfer rate is reflected in the comparison graphs for the average transfer rate, but not in the performance consistency graph itself). We have not had this issue with any other storage bridge using the same drive – so, our recommendation for the FE2010 is not without reservation. We strongly believe that the FE2010 firmware needs further improvement.
On the other hand, we have no hesitation in recommending the UA1001 despite its need for careful handing. The design, size and choice of build material makes it quite fragile. However, its versatility needs appreciation – it is a must-have gadget for all consumers who have to deal with multiple SATA devices and PCs in an efficient manner.