
Best SSDs: July 2014

Given the recent product releases in the SSD industry, it is now a good time to do another purchase recommendation post. We did our first “Best SSDs” post in November last year and it received quite a bit of interest by providing simple recommendations instead of a several thousand word analysis like we usually do in our reviews. Quite surprisingly, our previous recommendations were still accurate until about a month ago when Crucial rolled out the MX100, so despite the fact that the article is now eight months old there was no immediate need for an updated post until now.
Similar to the previous post, I will be splitting the recommendations in different categories by form factor and performance. Note that pricing fluctuates constantly and there may be regional differences, so I would still recommend to check the prices from several stores and use your own consideration when buying a drive.
Enthusiast and Professional Level: Samsung SSD 850 Pro & SanDisk Extreme Pro
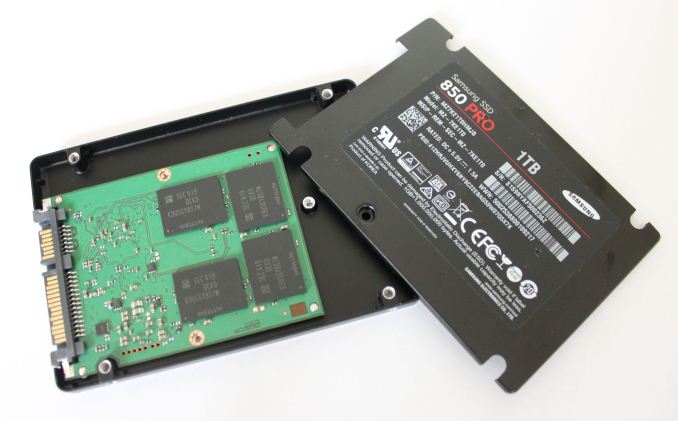
The Samsung 850 Pro is one unique drive. It is the first mainstream SSD to utilize 3D NAND, which gives Samsung substantial advantages in performance and endurance. As a result, the 850 Pro is the fastest SSD we have tested and is backed up by an industry-leading 10-year warranty or 150TB of writes, which ever comes first. Feature wise the 850 Pro supports both TCG Opal 2.0 / eDrive and DevSleep, meaning that the drive is suitable for mobile as well as corporate environments. The 850 Pro also has a feature called RAPID, which utilizes a portion of the system DRAM (up to 4GB) to cache reads and writes to further increase performance.
The 850 Pro’s toughest competitor is SanDisk’s Extreme Pro. While the 850 Pro is generally a faster drive, the Extreme Pro comes very close. It too is backed up by a 10-year warranty, although the write endurance is only rated at 80TB. Due to higher over-provisioning, the usable capacities in the Extreme Pro end up being slightly smaller compared to the 850 Pro and you also lose TCG Opal 2.0 / eDrive support.
| Samsung SSD 850 Pro | SanDisk Extreme Pro | |
| Pros |
– Higher performance – Higher usable capacities – Higher endurance – TCG Opal 2.0 & eDrive support – RAPID |
– Price of the larger capacities |
| Cons | – Price of the larger capacities |
– No hardware encryption support – Lower endurance |
I am usually not a big fan of pros&cons tables because they tend to oversimplify things, but in this case I think the comparison does justice and provides a quick way to compare the 850 Pro and Extreme Pro. It is clear that the 850 Pro is ultimately the better drive but the Extreme Pro can be a better option if you are in the look for a high performance 1TB-class drive but do not see any additional value in the 850 Pro’s features (namely hardware encryption and RAPID).
| Capacity | 120/128GB | 240/256GB | 480/512GB | 960/1024GB |
| Samsung SSD 850 Pro |
$130 ($1.02/GB) £90 (£0.70/GB) |
$200 ($0.78/GB) £155 (£0.61/GB) |
$400 ($0.78/GB) £295 (£0.58/GB) |
$700 ($0.68/GB) £485 (£0.47/GB) |
| SanDisk Extreme Pro | – |
$210 ($0.88/GB) £135 (£0.56/GB) |
$370 ($0.77/GB) £252 (£0.53/GB) |
$600 ($0.63/GB) £392 (£0.41/GB) |
That said, if you want the best SATA 6Gbps drive in the market, the 850 Pro is the drive to buy. You will have to pay a small premium at the higher capacities, although the price delta may even out in the future and make the 850 Pro a better buy in all aspects. Alternatively, if the prices of the Extreme Pro come down (or you are in a region where the price difference is higher than in the US), the Extreme Pro is a viable alternative as long as you have no need for hardware encryption.
Mainstream Level: Crucial MX100 & Samsung SSD 840 EVO
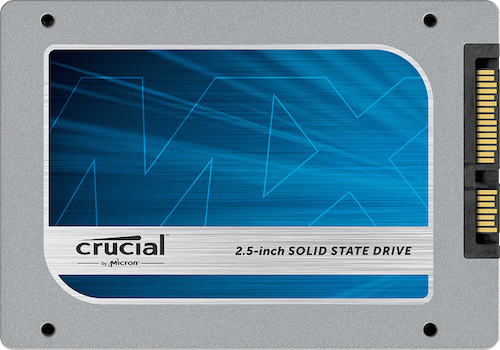
In the mainstream segment, the MX100 dominates the market. The exceptional pricing alone makes the MX100 an alluring drive but the fact that the drive supports power-loss protection, DevSleep and hardware encryption (TCG Opal 2.0 & eDrive) makes it an excellent bang for the buck. With performance good enough for typical client workloads, there is simply no way you can go wrong with the MX100, unless your workload requires a higher performance drive.
| Capacity | 120/128GB | 250/256GB | 500/512GB | 1TB |
| Crucial MX100 |
$75 ($0.59/GB) £54 (£0.42/GB) |
$110 ($0.43/GB) £94 (£0.37/GB) |
$215 ($0.42/GB) £161 (£0.31/GB) |
– |
| Samsung SSD 840 EVO |
$90 ($0.75/GB) £57 (£0.47/GB) |
$140 ($0.56/GB) £88 (£0.35/GB) |
$260 ($0.52/GB) £165 (£0.33/GB) |
$470 ($0.47/GB) £300 (£0.30/GB) |
The only disadvantage of the MX100 is the lack of a 1TB model, which is why I am recommending the 840 EVO as well since it comes in 1TB flavor. In terms of features and performance the MX100 and 840 EVO are very close with the biggest difference being that the EVO has no power-loss protection, although on the other hand it supports RAPID, which the MX100 does not have. As a result, the only reason I am picking the MX100 over the 840 EVO is the price but if you can find the 840 EVO cheaper (or are looking for a 1TB drive), then do not hesitate to buy the 840 EVO instead of the MX100.
Killing Off The SATA Bottleneck: Samsung XP941
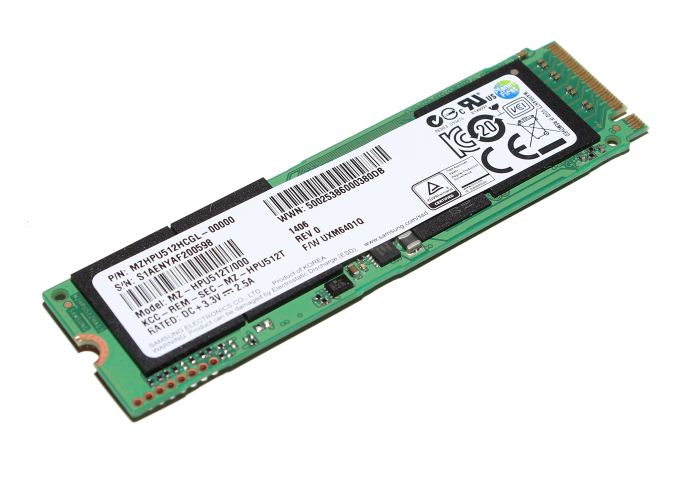
PCIe has certainly been one of the most discussed topics within the SSD industry this year. While the true roll out of native PCIe SSDs will not happen until next year, there are now a couple of drives available. The only drive that I find interesting is the Samsung XP941 because it is currently the only native PCIe 2.0 x4 drive, whereas the other drives in the market are limited to x2, which does not provide that much benefit over SATA 6Gbps. As a result the XP941 is the fastest client SSD we have tested to date and is hence the ultimate drive for performance hungry enthusiasts.
The only downside is that you will need a Z97 based motherboard (or a Mac Pro) to be able to boot from the drive and even then you are limited to certain models (at this point ASRock Z97 Extreme6 is the only board with official boot support, although the drive can be made bootable in some ASUS boards as well). Thus I would only recommend the XP941 if you are running a supported motherboard because otherwise the XP941 can only be used as a secondary drive. Compared to the 850 Pro you will also lose hardware encryption plus RAPID support and the warranty drops to three years.
| Capacity | 256GB | 512GB |
| Samsung XP941 |
$311 ($1.21/GB) – |
$500 ($0.98/GB) £400 (£0.78/GB) |
The pricing is also rather high compared to the 850 Pro but that is the premium you have to pay for cutting edge technology. Interestingly enough, the 512GB XP941 is currently available in NewEgg even though the drive is an OEM product. Unfortunately the 256GB model is not but you can still find it from RamCity, which was the first vendor to sell the XP941 to consumers and also supplied us with review samples.
All in all, if you are willing to pay the premium and sacrifice support for the opportunity to be at the edge of a new technology, the XP941 is the drive to buy.
The Tiny, Yet Powerful mSATA: Crucial M500 mSATA, Samsung SSD 840 EVO mSATA & Plextor M6M
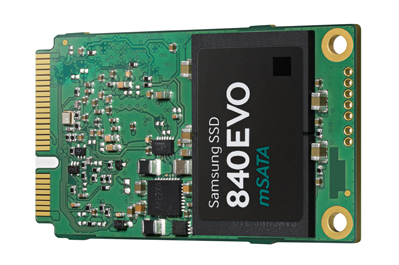
While the SSD and PC industries are moving away from mSATA to M.2, there is a notable upgrade market for mSATA drives. mSATA never really took off so the available SKUs are still rather limited, but fortunately there are a couple of drives that stand out. The first one is the mSATA version of the Samsung 840 EVO, which is the little brother of the 2.5″ 840 EVO we already recommended above. You get the same set of features (hardware encryption, DevSleep, RAPID…) and performance as with the full size 840 EVO, so the EVO mSATA is a great value despite its small size.
An alternative to the 840 EVO mSATA is Plextor’s M6M. The M6M lacks TCG Opal 2.0 and eDrive compliance and is also a bit slower than the 840 EVO, but it is still a good option for typical client workloads as long as the lack of hardware encryption is not a deal breaker.
Update: I have added Crucial M500 mSATA to the list since it is the most affordable mSATA SSD and still offers a great set of features (hardware encryption and power-loss protection) and decent performance. Initially I left it out as I thought it had been discontinued like its 2.5″ sibling but looks like it is still available and seems to be the best value.
| Capacity | 64GB | 120/128GB | 250/256GB | 500/512GB | 1TB |
| Samsung SSD 840 EVO mSATA | – |
$100 ($0.83/GB) £70 (£0.58/GB) |
$160 ($0.64/GB) £105 (£0.42/GB) |
$300 ($0.60/GB) £185 (£0.37/GB) |
$500 ($0.50/GB) £330 (£0.33/GB) |
| Plextor M6M |
$60 ($0.94/GB) £50 (£0.78/GB) |
$86 ($0.67/GB) £83 (£0.64/GB) |
$150 ($0.59/GB) £116 (£0.46/GB) |
$360 ($0.70/GB) – |
– |
| Crucial M500 mSATA | – |
$75 ($0.59/GB) £52 (£0.43/GB) |
$125 ($0.52/GB) £89 (£0.37/GB) |
$240 ($0.50/GB) £168 (£0.35/GB) |
– |
The 840 EVO mSATA does not come in 64GB flavor at all, so if you are looking for a small and cheap boot mSATA drive, then the M6M is our only recommendation, although I strogly advice that you pay $26 more for doubled capacity. At 120/128GB the M6M is a better pick due to its cheaper price, unless you see added value in the features of the 840 EVO mSATA. However, at 250/256GB and higher the EVO is certainly a better value for the money.
Given the price of the M500 mSATA, it is the best value for most consumers. While performance is not as good as with the 840 EVO, the M500 mSATA is fast enough for average consumer workloads and is thus the drive we recommend. Users who seek for more performance in an mSATA form factor may find the 840 EVO to be worth the extra money but otherwise the M500 mSATA is a better buy. The only exception is at 1TB where the 840 EVO mSATA is the only option.
The Gumstick M.2: Crucial M550 M.2
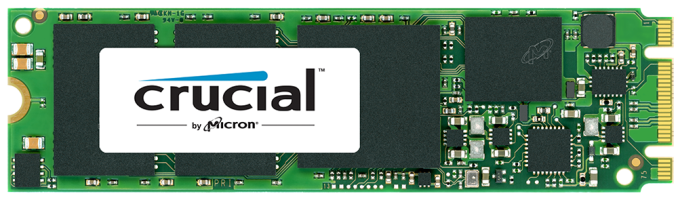
The market for aftermarket M.2 SSDs is relatively small right now since systems with M.2 have not been shipping for long but the market is constantly growing. I could not find many available on NewEgg but if I was on the market for one I would pick Crucial’s M.2 version of the M550. We have not reviewed the M.2 version but it is fairly safe to assume that the performance is similar to the 2.5″ version (our review). The M550 M.2 is type 2280, so make sure that it is compatible with your motherboard or laptop since some only accept smaller M.2 sizes. Like the MX100, the M550 M.2 features an extensive feature set including power-loss protection and TCG Opal 2.0 / eDrive support along with DevSleep support.
Note: The M550 M.2 is a SATA 6Gbps drive, so before buying the drive make sure that the slot in your motherboard or laptop supports SATA. Some only support PCIe, meaning that the M550 will not work in such slot.
| Capacity | 128GB | 256GB | 512GB |
| Crucial M550 M.2 |
$100 ($0.78/GB) £68 (£0.53/GB) |
$170 ($0.66/GB) – |
$330 ($0.64/GB) £228 (£0.45/GB) |
To Conclude:
The last couple of months have been very interesting in the SSD industry. We have seen quite a few new SSDs and it seems like the flow will not end. From what I have heard, we should see several TLC NAND based SSDs this year, which will help to drive the cost per gigabyte down. Additionally, more PCIe SSDs should start to roll out early next year, so the XP941 should finally see some real competition.