The last few years have seen rapid advancements in flash technology and the rise of USB 3.0 as an ubiquitous high-speed interface on computers. These have led to the appearance of small and affordable direct attached storage units with very high performance for day-to-day data transfer applications. We have already looked at some flash drives with SSD controllers and a USB 3.0 – SATA bridge over the last year.
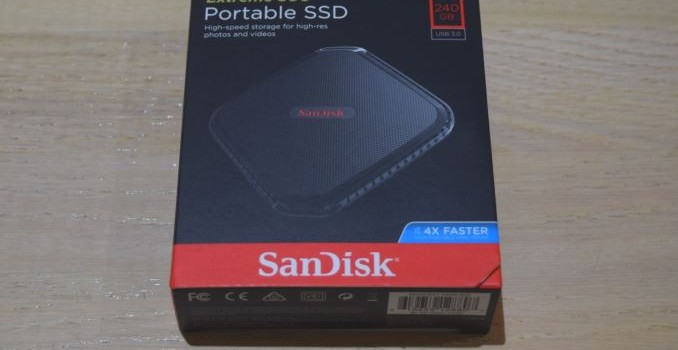
At Computex 2015, SanDisk announced a host of high-speed flash-based direct attached storage units. With the introduction of the Extreme 500, SanDisk became the second Tier 1 vendor to enter the external SSD market. SanDisk provided us with a 240GB Extreme 500 review sample.
Hardware-wise, the Extreme 500 is based on the SanDisk SSD PLUS series. While SanDisk refuses to divulge controller and flash information, we did open up our review sample to get a look at the internal components. SanDisk did indicate that the particular controllers and memory may change over time, but are guaranteed to meet the performance specs.

SATA Controller – Silicon Motion SMI2246XT, Flash – 4x 64GB SanDisk 05448 064G

SATA – USB 3.0 Bridge – ASMedia ASM1153E
The drive doesn’t give up any information via either CrystalDiskInfo or the latest version of ChipGenius. However, SanDisk confirmed that the Extreme 500 does support TRIM and also does garbage collection as well when plugged in. There is no support for explicit over-provisioning, but there really is no advantage to doing it, since the drive already comes over-provisioned (given the 240 GB capacity with 4x64G flash chips).
Testbed Setup and Testing Methodology
Evaluation of DAS units on Windows is done with the testbed outlined in the table below. For devices with USB 3.0 connections (such as the Extreme 500 that we are considering today), we utilize the USB 3.0 port directly hanging off the PCH. However, SanDisk suggested reviewing with a USB 3.1 port, and hence, we also tested with an ASRock USB 3.1/A+C PCIe card attached to the primary PCIe x16 slot of the testbed below.
| AnandTech DAS Testbed Configuration |
| Motherboard |
Asus Z97-PRO Wi-Fi ac ATX |
| CPU |
Intel Core i7-4790 |
| Memory |
Corsair Vengeance Pro CMY32GX3M4A2133C11
32 GB (4x 8GB)
DDR3-2133 @ 11-11-11-27 |
| OS Drive |
Seagate 600 Pro 400 GB |
| Optical Drive |
Asus BW-16D1HT 16x Blu-ray Write (w/ M-Disc Support) |
| Add-on Card |
Asus Thunderbolt EX II |
| Chassis |
Corsair Air 540 |
| PSU |
Corsair AX760i 760 W |
| OS |
Windows 8.1 Pro |
| Thanks to Asus and Corsair for the build components |
The full details of the reasoning behind choosing the above build components can be found here. The list of DAS units used for comparison purposes is provided below.
- SanDisk Extreme 500 240GB – USB 3.1
- SanDisk Extreme 500 240 GB – USB 3.0
- Corsair Voyager GTX 256GB
- Corsair Voyager GTX v2 256GB
- Patriot Supersonic Rage 2 256GB
- SanDisk Extreme 500 240GB – USB 3.0
- VisionTek Pocket SSD 240GB
Synthetic Benchmarks – ATTO and Crystal DiskMark
SanDisk claims read and write speeds of 415 MBps and 340 MBps respectively, and these are backed up by the ATTO benchmarks provided below. Unfortunately, these access traces are not very common in real-life scenarios. Interestingly, we don’t get these numbers with the USB 3.0 port.
SanDisk Extreme 500 240GB – USB 3.1SanDisk Extreme 500 240 GB – USB 3.0Corsair Voyager GTX 256GBCorsair Voyager GTX v2 256GBPatriot Supersonic Rage 2 256GBSanDisk Extreme 500 240GB – USB 3.0VisionTek Pocket SSD 240GB

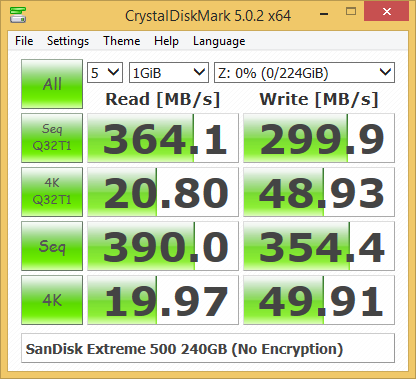
CrystalDiskMark, despite being a canned benchmark, provides a better estimate of the performance range with a selected set of numbers. As evident from the screenshot below, the performance can dip to as low as 20 MBps for 4K accesses. Fortunately, those are not typical access traces for external drives.
SanDisk Extreme 500 240GB – USB 3.1SanDisk Extreme 500 240 GB – USB 3.0Corsair Voyager GTX 256GBCorsair Voyager GTX v2 256GBPatriot Supersonic Rage 2 256GBSanDisk Extreme 500 240GB – USB 3.0VisionTek Pocket SSD 240GB
Benchmarks – robocopy and PCMark 8 Storage Bench
Our testing methodology for DAS units also takes into consideration the usual use-case for such devices. The most common usage scenario is transfer of large amounts of photos and videos to and from the unit. The minor usage scenario is importing files directly off the DAS into a multimedia editing program such as Adobe Photoshop.
In order to tackle the first use-case, we created three test folders with the following characteristics:
- Photos: 15.6 GB collection of 4320 photos (RAW as well as JPEGs) in 61 sub-folders
- Videos: 16.1 GB collection of 244 videos (MP4 as well as MOVs) in 6 sub-folders
- BR: 10.7 GB Blu-ray folder structure of the IDT Benchmark Blu-ray (the same that we use in our robocopy tests for NAS systems)


For the second use-case, we take advantage of PC Mark 8’s storage bench. The storage workload involves games as well as multimedia editing applications. The command line version allows us to cherry-pick storage traces to run on a target drive. We chose the following traces.
- Adobe Photoshop (Light)
- Adobe Photoshop (Heavy)
- Adobe After Effects
- Adobe Illustrator
Usually, PC Mark 8 reports time to complete the trace, but the detailed log report has the read and write bandwidth figures which we present in our performance graphs. Note that the bandwidth number reported in the results don’t involve idle time compression. Results might appear low, but that is part of the workload characteristic. Note that the same testbed is being used for all DAS units. Therefore, comparing the numbers for each trace should be possible across different DAS units.


Performance Consistency
Yet another interesting aspect of these types of units is performance consistency. Aspects that may influence this include thermal throttling and firmware caps on access rates to avoid overheating or other similar scenarios. This aspect is an important one, as the last thing that users want to see when copying over, say, 100 GB of data to the flash drive, is the transfer rate going to USB 2.0 speeds. In order to identify whether the drive under test suffers from this problem, we instrumented our robocopy DAS benchmark suite to record the flash drive’s read and write transfer rates while the robocopy process took place in the background. For supported drives, we also recorded the internal temperature of the drive during the process. The graphs below show the speeds observed during our real-world DAS suite processing. The first three sets of writes and reads correspond to the photos suite. A small gap (for the transfer of the videos suite from the primary drive to the RAM drive) is followed by three sets for the next data set. Another small RAM-drive transfer gap is followed by three sets for the Blu-ray folder.
An important point to note here is that each of the first three blue and green areas correspond to 15.6 GB of writes and reads respectively. Throttling, if any, is apparent within the processing of the photos suite itself.
SanDisk Extreme 500 240GB – USB 3.1SanDisk Extreme 500 240 GB – USB 3.0Corsair Voyager GTX 256GBCorsair Voyager GTX v2 256GBPatriot Supersonic Rage 2 256GBSanDisk Extreme 500 240GB – USB 3.0VisionTek Pocket SSD 240GB

It can be seen that the Extreme 500 manages to remain under 55 C even under heavy workload conditions. There is no throttling to be seen anywhere. This is not really surprising given the form factor of the unit.
Concluding Remarks
Coming to the business end of the review, the Extreme 500 continues SanDisk’s tradition of improving the performance of their external USB 3.0 flash storage every year. As icing on the cake, we have them officially using a real SSD controller in the form of the Silicon Motion SMI2246XT inside. The performance of the drive leaves us with no doubt that it would be a decent portable OS drive (even though SanDisk doesn’t advertise it for that purpose).
Our major concern with the unit is that it refuses to perform up to expectations with the native USB 3.0 port on the Z97 PCH (at least in our testbed configuration). The dismal write performance with the USB 3.0 port is indeed quite strange. Since the Extreme 500 is a USB 3.0/5G device, it shouldn’t really get a bump out of the higher USB 3.1 Gen 2/10G bandwidth. We believe the issue could be just due to how the Z97 PCH USB 3.0 port negotiates speed with the USB bridge chip. Obviously, the ASM1153E on the Extreme 500 is able to perform well with the ASM1143 USB 3.1 controller on the add-on card.
Minor points of concern include SanDisk indicating that the controllers and flash could change in future production runs and the inability of standard tools to recognize and take actions on the drive based on S.M.A.R.T data.

The 240GB SSD PLUS is available on Amazon for $70 while a UASP USB 3.0 2.5″ drive enclosure can be purchased for less than $15. At the $120 price point, the Extreme 500 does carry a significant premium (even when the bundled encryption software is considered). That said, the portability and industrial design of the Extreme 500 is much better than that of an off-the-shelf enclosure. In terms of performance, the Extreme 500 240GB manages to come out at the top of the pack for most common external drive usage scenarios and exhibits excellent performance consustency. We would like to see SanDisk exploring such high-performance platforms in a flash drive form factor.