Vik


Toshiba Begins to Sample eMLC-Based ZD6300 7.68 TB SSDs to Customers

Toshiba Begins to Sample eMLC-Based ZD6300 7.68 TB SSDs to Customers

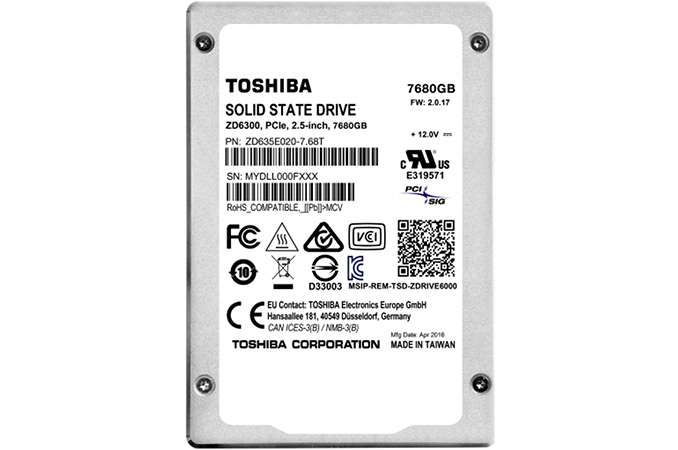
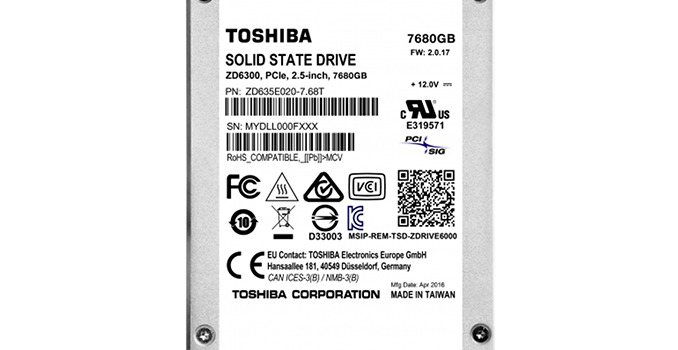
Toshiba has quietly expanded its ZD6300 family of SSDs with a 7.68 TB model, its most capacious storage device announced to date. The new drive was designed for mixed workloads and uses Toshiba’s time-proven A19 eMLC NAND flash memory. Due to enhanced endurance and a lot of NAND used for overprovisioning, the SSD can be pre-ordered for approximately $12,000, depending on the seller, though its official MSRP is still unknown.

The Toshiba ZD6300 7.68 TB (ZD635E020-7.68T) SSD uses PMC-Sierra’s “Princeton” controller (which is now called Flashtec NVMe PM8604 1032) with PCIe 3.0 x8 interface (which Toshiba splits into two x4 interfaces), 16 NAND flash channels and NVMe 1.1b protocol. The drive will be available in 2.5”/15 mm form-factor with U.2 connector (SFF-8639) in a bid to enable compatibility with different server chassis (specifically for those, which support multiple SSDs). The new 7.68 TB drive from Toshiba support the same functionality as other ZD-series drives from the company (which were originally introduced under OCZ brand), such as dual-port capability, AES-256 encryption, full power loss protection, end-to-end data protection and so on.

OCZ Z-Drive 6000 Series Specifications
  6000 6300 6300 Max Capacity
Capacities 800 GB, 1,600 GB, 3,200 GB, 6,400 GB 960 GB, 1920 GB, 3840 GB, 7680 GB
Form Factors 2.5″/15mm U.2 2.5″ 15mm & HHHL AIC 2.5″/15mm U.2
Interface PCIe 3.0 x4 (NVMe 1.1b)
Controller PMC-Sierra “Princeton” aka Flashtec NVMe PM8604 1032
NAND Toshiba A19nm 128Gbit MLC Toshiba A19nm 128Gbit eMLC
Endurance 1 DWPD 3 DWPD 1 DWPD
Encryption AES-256
Power Loss Protection Yes
Warranty Five Years

The ZD6300 7.68 TB SSD uses higher durability eMLC memory to guarantee better endurance, which is why it supports maximum sequential write speed of up to 2.9 GB/s (in line with the ZD6000-series drives). However its maximum sequential write speed is 1.4 GB/s (or actually lower) due to higher program latencies of eMLC (which is in line with other ZD6300-series products).

Typically, the key differences between the ZD6000 and the ZD6300 SSDs (which were officially announced) were usage of eMLC by the latter in order to enable three drive writes per day (DWPD) over a five-year period, which was more suitable for mixed workloads (something that the ZD6300 were designed for). What is important is that the Toshiba ZD6300 7.68 TB SSD belongs to the less-known Max Capacity sub-family from the Z-Drive 6300 product stack that uses eMLC, but not in order to enable 3 DWPDs, but to maximize capacity using more durable ICs. The ZD6300 Max Capacity family has not been announced officially, but such SSDs are available for purchase (as pointed out by Ilya Gavrichenkov, my former colleague from another web-site). The ZD6300 Max Capacity drives do not reserve vast amounts of eMLC NAND flash for overprovisioning, unlike the regular ZD6300-series products, to enhance endurance, but this allows it to increase capacities by 20%, albeit at a relatively high per-gigabyte cost.

Consequently, from a raw NAND capacity configuration point of view, Toshiba’s ZD6300 7.68 TB SSD is the same drive as the ZD6300 6.4 TB product: it has 8128 GB of memory, but it makes 7680 GB available to the user rather than 6400 GB. Just like the ZD6300 6.4 TB drives, the 7.68 TB model uses 32 of 16-die packages featuring 128 Gb eMLC NAND flash memory devices produced using Toshiba’s second-generation 19 nm process technology.

It should be noted that apart from the ZD6000/ZD6300 SSDs with one or three DWPD, Toshiba also offers high-endurance SSDs with 10 or 25 DWPDs in their ZD-series product lineup. Such drives are naturally more expensive, but those, who need very high endurance, are usually willing to invest in such storage solutions. Still, since requirements of such customers are very diverse, Toshiba does not publish specs of such drives because virtually all of them are built to order and are not available from usual resellers.

Speaking of availability, Toshiba tells us that it is sampling the ZD6300 7.68 TB product with customers. Meanwhile, there are several resellers, who are offering to pre-order the SSD for $12,563, $12,090 or even $11,252. Since the product is still in the sampling stage and is not yet officially shipping, Toshiba naturally keeps its actual price under wraps.

NVIDIA Announces Record Revenue For The Second Quarter Of Fiscal Year 2017

NVIDIA Announces Record Revenue For The Second Quarter Of Fiscal Year 2017

This afternoon, NVIDIA announced their quarterly earnings for the second quarter of their 2017 fiscal year, which ended July 31. NVIDIA had record revenues for the quarter, coming in at $1.43 billion, which is up 24% from a year ago. Gross margin for the quarter was 57.9%, up 2.9% from a year ago, while operating expenses fell 9% to $509 million. Operating income for the quarter was $317 million, up 317% from Q2 2016 where it was just $76 million due to a write-down of the Icera modem division. This also impacted net income, which was up 873% to $253 million, and earnings per share of $0.40 was up 700% compared to the Q2 2016 results.

NVIDIA Q2 2017 Financial Results (GAAP)
  Q2’2017 Q1’2017 Q2’2016 Q/Q Y/Y
Revenue (in millions USD) $1428 $1305 $1153 +9% +24%
Gross Margin 57.9% 57.5% 55.0% +0.4% +2.9%
Operating Income (in millions USD) $317 $245 $76 +29% +317%
Net Income $253 $196 $26 +29% +873%
EPS $0.40 $0.33 $0.05 +21% +700%

NVIDIA also released Non-GAAP measures, which “exclude stock-based compensation, legal settlement costs, product warranty charge, acquisition-related costs, contributions, restructuring and other charges, gains from non-affiliated investments, interest expense related to amortization of debt discount, and the associated tax impact of these items, where applicable” and therefore don’t factor in the Icera write-down. In Non-GAAP measures, revenue was the same $1.428 billion, and gross margin was 58.1% which was up 1.5% from the Q2 2016 Non-GAAP results. Operating income was up 65% to $328 million, and net income was up the same 65% to $313 million. Earnings per share were up 56% to $0.53 compared to last year’s Non-GAAP results.

NVIDIA Q2 2017 Financial Results (Non-GAAP)
  Q2’2017 Q1’2017 Q2’2016 Q/Q Y/Y
Revenue (in millions USD) $1428 $1305 $1153 +9% +24%
Gross Margin 58.1% 58.6% 56.6% -0.5% +1.5%
Operating Income (in millions USD) $382 $322 $231 +19% +65%
Net Income $313 $263 $190 +19% +65%
EPS $0.53 $0.46 $0.34 +15% +56%

At the heart of this is NVIDIA’s GPU business, which has diversified quite a bit over the last several years. For Q2 2017, NVIDIA’s GPU business brought in $1.196 billion in revenue, up 18% from last year and up 14% over last quarter. NVIDIA’s Tegra platform, which is primarily automotive now, but still powering a couple of consumer devices like the SHIELD Tablet K1 and the SHIELD Android TV, brought in revenues of $166 million, which is up 30% from a year ago. NVIDIA’s “other” category is the $66 million they report per quarter for the payment from Intel for licensing.

Broken down by market, gaming is still the largest market for NVIDIA, with revenues of $781 million attributed to gaming, which is up 18% year-over-year. This has been spurred by the recent releases of their latest Pascal GPUs for the desktop, which hold the current performance crown with the move to a new FinFET node. Professional Visualization brought in $214 million, up 22% from a year ago, and NVIDIA just announced Pascal based Quadro cards as well, so I would expect this growth to continue if Quadro matches GeForce. The Datacenter revenue had the biggest jump, up 110% year-over-year to $151 million, and NVIDIA has put a lot of effort and marketing into deep learning to achieve this kind of growth. Automotive accounted for $119 million in revenue, up 68% from a year ago, and NVIDIA’s OEM and IP market was the only one to see a small loss of 6% revenue compared to last year, down to $163 million.

NVIDIA Quarterly Revenue Comparison (GAAP)
In millions Q2’2017 Q1’2017 Q2’2016 Q/Q Y/Y
GPU $1196 $1079 $959 +11% +25%
Tegra Processor $166 $160 $128 +4% +30%
Other $66 $66 $66 flat flat

For next quarter, NVIDIA is expecting revenues of $1.68 billion, plus or minus 2%, with GAAP margins of 57.8% and non-GAAP margins of 58.0%, plus or minus 0.5%.

With record revenue, a more diversified platform, and the current GPU performance crown, NVIDIA has been easily outperforming the PC market with their strong focus on one of the few bright spots in the PC market – gaming. We’ve seen several companies transition to practically only selling gaming computers, and that is because of the higher margins and strong sales they’ve seen. NVIDIA has been riding this wave with successful launches of it’s Maxwell products, and now Pascal.

Source: NVIDIA Investor Relations

NVIDIA Announces Record Revenue For The Second Quarter Of Fiscal Year 2017

NVIDIA Announces Record Revenue For The Second Quarter Of Fiscal Year 2017

This afternoon, NVIDIA announced their quarterly earnings for the second quarter of their 2017 fiscal year, which ended July 31. NVIDIA had record revenues for the quarter, coming in at $1.43 billion, which is up 24% from a year ago. Gross margin for the quarter was 57.9%, up 2.9% from a year ago, while operating expenses fell 9% to $509 million. Operating income for the quarter was $317 million, up 317% from Q2 2016 where it was just $76 million due to a write-down of the Icera modem division. This also impacted net income, which was up 873% to $253 million, and earnings per share of $0.40 was up 700% compared to the Q2 2016 results.

NVIDIA Q2 2017 Financial Results (GAAP)
  Q2’2017 Q1’2017 Q2’2016 Q/Q Y/Y
Revenue (in millions USD) $1428 $1305 $1153 +9% +24%
Gross Margin 57.9% 57.5% 55.0% +0.4% +2.9%
Operating Income (in millions USD) $317 $245 $76 +29% +317%
Net Income $253 $196 $26 +29% +873%
EPS $0.40 $0.33 $0.05 +21% +700%

NVIDIA also released Non-GAAP measures, which “exclude stock-based compensation, legal settlement costs, product warranty charge, acquisition-related costs, contributions, restructuring and other charges, gains from non-affiliated investments, interest expense related to amortization of debt discount, and the associated tax impact of these items, where applicable” and therefore don’t factor in the Icera write-down. In Non-GAAP measures, revenue was the same $1.428 billion, and gross margin was 58.1% which was up 1.5% from the Q2 2016 Non-GAAP results. Operating income was up 65% to $328 million, and net income was up the same 65% to $313 million. Earnings per share were up 56% to $0.53 compared to last year’s Non-GAAP results.

NVIDIA Q2 2017 Financial Results (Non-GAAP)
  Q2’2017 Q1’2017 Q2’2016 Q/Q Y/Y
Revenue (in millions USD) $1428 $1305 $1153 +9% +24%
Gross Margin 58.1% 58.6% 56.6% -0.5% +1.5%
Operating Income (in millions USD) $382 $322 $231 +19% +65%
Net Income $313 $263 $190 +19% +65%
EPS $0.53 $0.46 $0.34 +15% +56%

At the heart of this is NVIDIA’s GPU business, which has diversified quite a bit over the last several years. For Q2 2017, NVIDIA’s GPU business brought in $1.196 billion in revenue, up 18% from last year and up 14% over last quarter. NVIDIA’s Tegra platform, which is primarily automotive now, but still powering a couple of consumer devices like the SHIELD Tablet K1 and the SHIELD Android TV, brought in revenues of $166 million, which is up 30% from a year ago. NVIDIA’s “other” category is the $66 million they report per quarter for the payment from Intel for licensing.

Broken down by market, gaming is still the largest market for NVIDIA, with revenues of $781 million attributed to gaming, which is up 18% year-over-year. This has been spurred by the recent releases of their latest Pascal GPUs for the desktop, which hold the current performance crown with the move to a new FinFET node. Professional Visualization brought in $214 million, up 22% from a year ago, and NVIDIA just announced Pascal based Quadro cards as well, so I would expect this growth to continue if Quadro matches GeForce. The Datacenter revenue had the biggest jump, up 110% year-over-year to $151 million, and NVIDIA has put a lot of effort and marketing into deep learning to achieve this kind of growth. Automotive accounted for $119 million in revenue, up 68% from a year ago, and NVIDIA’s OEM and IP market was the only one to see a small loss of 6% revenue compared to last year, down to $163 million.

NVIDIA Quarterly Revenue Comparison (GAAP)
In millions Q2’2017 Q1’2017 Q2’2016 Q/Q Y/Y
GPU $1196 $1079 $959 +11% +25%
Tegra Processor $166 $160 $128 +4% +30%
Other $66 $66 $66 flat flat

For next quarter, NVIDIA is expecting revenues of $1.68 billion, plus or minus 2%, with GAAP margins of 57.8% and non-GAAP margins of 58.0%, plus or minus 0.5%.

With record revenue, a more diversified platform, and the current GPU performance crown, NVIDIA has been easily outperforming the PC market with their strong focus on one of the few bright spots in the PC market – gaming. We’ve seen several companies transition to practically only selling gaming computers, and that is because of the higher margins and strong sales they’ve seen. NVIDIA has been riding this wave with successful launches of it’s Maxwell products, and now Pascal.

Source: NVIDIA Investor Relations