Evaluating the Toshiba OCZ RD400 M.2 NVMe SSD on a Skylake NUC
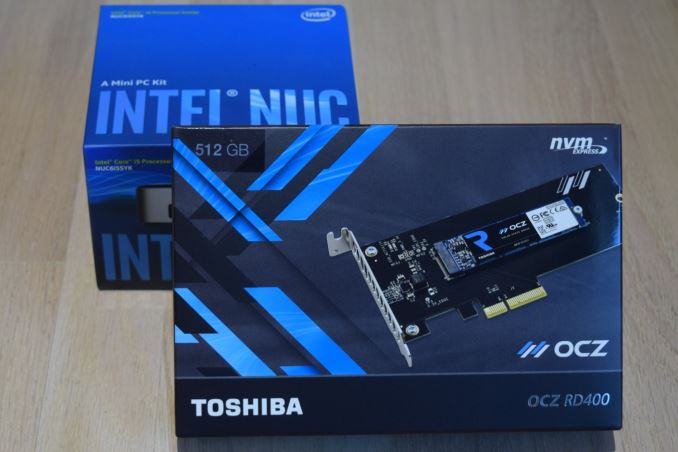
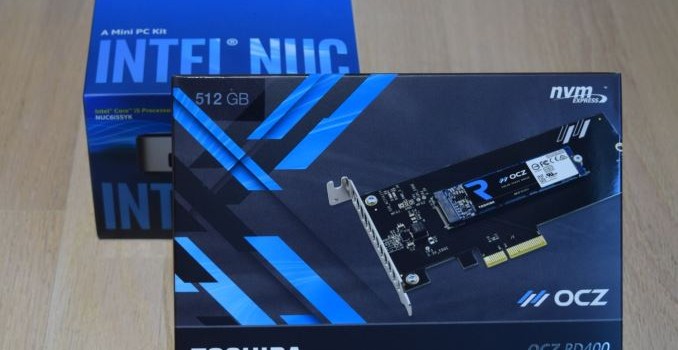
The Skylake NUCs have faced plenty of issues since their introduction late last year. However, stability has improved with the latest BIOS updates. One of the issues with the early BIOS versions was the M.2 SSD slot being effectively limited to PCIe 2.0 rates despite the chipset supporting PCIe 3.0. The latest BIOS version resolves this issue. We had carried a detailed evaluation of different M.2 SSDs for usage in the Skylake NUC. At that time, the Samsung SSD 950 PRO was the only option for providing maximum possible theoretical performance – a NVMe SSD with a PCIe 3.0 x4 link. Since then, Toshiba has also entered the fray with the Toshiba OCZ RD400. The RD400 has already been put through our rigorous SSD evaluation suite. In this review, we take a look at how the 512GB version fares in the NUC6i5SYK.
Introduction to the Toshiba OCZ RD400
The Toshiba OCZ RD400 is a PCIe 3.0 x4 NVMe SSD in the M.2 form factor. It can be purchased either in standalone M.2 2280 form factor, or with an add-in card. We have already discussed the RD400 hardware in detail. The important takeaway is that the controller is likely to be the Marvell 88SS1093, though we do not have direct confirmation of this aspect.


The 512GB version we evaluated is a single-sided card with two flash packages, a single DRAM package and the controller on board. These packages are covered by a sticker with the OCZ logo. In the Skylake NUC, the thermal strip attached to the lid is able to make contact with this sticker to aid in cooling down the components.
OCZ’s site provides a special driver that improves performance compared to the standard Microsoft NVMe driver that ships with Windows 10. The SSD Utility software also gives an overview of the current state of the drive (including the currently active driver).


There are plenty of SSDs compatible with the Intel NUC6i5SYK, but, what does one choose for the best experience? There are decisions to make – PCIe 3.0 vs. PCIe 2.0, NVMe vs. AHCI, PCIe vs. SATA and so on. In this review, we are going to compare the Toshiba OCZ RD400 against four other M.2 SSD options:
- Toshiba OCZ RD400 512GB PCIe 3.0 x4 NVMe
- Samsung SM951 256GB PCIe 3.0 x4 NVMe
- Samsung 950 PRO 512GB PCIe 3.0 x4 NVMe
- Kingston HyperX Predator 240GB PCIe 2.0 x4 AHCI
- Mushkin Atlas Vital 250GB SATA 6Gbps
The table below summarizes the specifications (claimed by the manufacturers) for the various evaluated SSDs. The entries in bold indicate the features corresponding to the tested sample.
| M.2 2280 SSD Options – Specifications | ||
| Drive | Toshiba OCZ RD400 | Toshiba OCZ RD400″ ;Samsung SM951″ ;Samsung SSD 950 PRO” ;Kingston HyperX Predator” ;Mushkin Atlas Vital” ; |
| Available Capacities | 128GB, 256GB, 512GB, 1TB | 128GB, 256GB, 512GB, 1TB |
| Interface | PCIe 3.0 x4 | PCIe 3.0 x4 |
| Supported Protocols | NVMe | NVMe |
| Evaluated Model | RVD400-M22280-512G | RVD400-M22280-512G |
| Controller | Toshiba TC58NCP070GSB | Toshiba TC58NCP070GSB |
| NAND | Toshiba 15nm MLC | Toshiba 15nm MLC |
| DRAM | 512MB | 512MB |
| Sequential Read | 2600 MB/s | 2600 MB/s |
| Sequential Write | 1600 MB/s | 1600 MB/s |
| 4KB Random Read | 190K IOPS | 190K IOPS |
| 4KB Random Write | 120K IOPS | 120K IOPS |
| Endurance | 296 TBW | 296 TBW |
| Street Price (as on date) | $310 | $310 |
| Warranty | 5 years | 5 years |
Prior to looking at the evaluation methodology and core benchmark numbers, we first confirm that the RD400 can meet the claimed performance numbers in the Skylake NUC with the latest BIOS.

CrystalDiskMark helps in that confirmation, and we see read bandwidth of more than 2600 MBps for high queue-depth scenarios.
Evaluation Methodology
Various PC benchmarks were processed on an Intel NUC6i5SYK (configured as specified in the table below) while keeping everything other than the M.2 SSD constant.
| Intel NUC6i5SYK Benchmarked Configuration | |
| Processor | Intel Core i5-6260U Skylake, 2C/4T, 1.8 GHz (Turbo to 2.9 GHz), 14nm, 4MB L2, 15W TDP |
| Memory | Corsair CMSX16GX4M2A2400C16 DDR4 15-15-15-35 @ 2133 MHz 2×8 GB |
| Graphics | Intel Iris Graphics 540 (Skylake-U GT3e) |
| Disk Drive(s) | Various M.2 SSDs |
| Operating System | Windows 10 Pro x64 |
| Full Specifications | Intel NUC6i5SYK Specifications |
The various benchmarks presented in the next few sections were all processed with the M.2 SSD as the primary drive. The drive was initialized with two partitions. The primary OS partition was set to be 120GB in size, while the remaining space was allocated to the secondary partition. Both of the partitions were formatted in NTFS with default settings.
Our focus is on real-world benchmarks – SYSmark 2014, PCMark 8 Storage Bench and a slightly tweaked AnandTech DAS Suite. The DAS suite also helps in providing information about the power consumption and thermal characteristics.
SYSmark 2014
BAPCo’s SYSmark 2014 is an objective performance benchmark for PCs. It is based on running real computer applications that one might use in day-to-day business / office activities. It is important to note that it does not intend to artificially drive components to peak capacity. Real user workloads and datasets are processed to determine how the user experience is impacted by the performance of the system.
SYSmark 2014 has three usage scenarios
- Office Productivity
- Media Creation
- Data/Financial Analysis.
The Office Productivity scenario models productivity usage including word processing, spreadsheet data manipulation, email creation/management and web browsing. The Media Creation scenario models using digital photos and digital video to create, preview, and render advertisements for a fictional businesses. The Data/Financial Analysis scenario creates, compresses, and decompresses data to review, evaluate and forecast business expenses. Also, the performance and viability of financial investments is analyzed using past and projected performance data.
The raw scores are meant to be compared against the 1000 scored by a Haswell Core i3-based desktop sporting a 500GB hard drive and 4GB of RAM. A score of 2000 would meant that the PC under test would appear to be twice as responsive as the calibration system.
SYSmark 2014’s whitepaper (PDF) includes sensitivity analysis – how the scores vary with the amount of RAM, processor choice, GPU, storage drive, OS and display resolution. The whitepaper’s sensitivity analysis for the storage subsystem involves comparison of a hard-drive based system and a SATA SSD. One can get as much as 20% improvement in scores (depending on the workload) by upgrading from a HDD to a SSD.
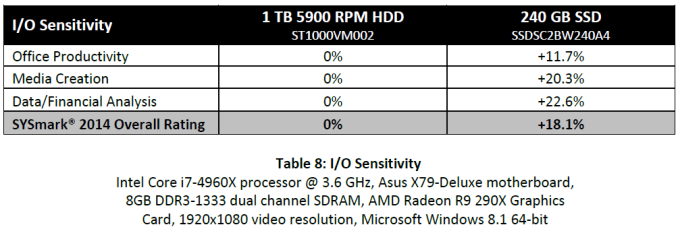
Since our evaluation also keeps all the system hardware and software the same, except for the storage drive, it also fits SYSmark 2014’s sensitivity analysis model. It is expected that moving from a hard drive to a SSD provides huge performance benefits. It is likely that there is not much difference between different NVMe drives, and our results confirm the same.


PCMark 8 Storage Bench
Futuremark’s PCMark 8 evaluates the performance of PCs with a variety of benchmarks for different use-case scenarios. We usually present the scenario scores in all our system reviews. It is similar to the SYSmark 2014 scoring in terms of presenting overall effectiveness of the system for day-to-day activities. However, PCMark 8 also includes a dedicated storage benchmark suite.
The PCMark 8 Storage test simulates disk activity by playing back a trace of storage activity recorded during actual use of applications from the Adobe Creative Suite, Microsoft Office and a selection of popular games. Idle time compression is is avoided to make the benchmark behave more like real-world applications. The benchmark keeps track of the time taken to complete playback of the trace (termed as the primary result). The secondary result is the total amount of data transferred (both reads and writes) divided by the storage I/O busy time (i.e, time duration during which the number of pending I/O operations was at least 1). The secondary result is a very important metric when idle time compression is involved, but it doesn’t matter as much as the primary result when it comes to application responsiveness (as the workload might be CPU-bound, rather than storage-bound).
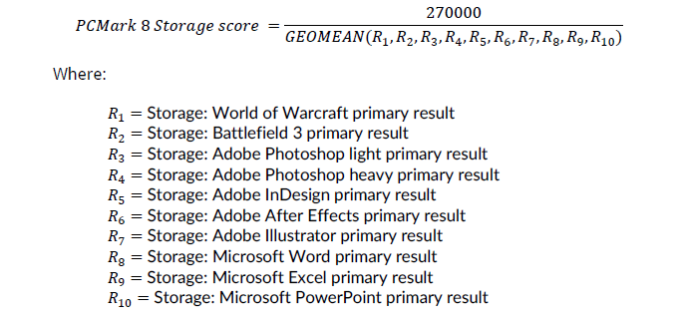
PCMark 8’s technical guide (PDF) explains the formulae used to arrive at the benchmark scores that are presented in the two graphs below.


Thermal Characteristics and Power Consumption
SYSmark 2014 and PCMark 8 provide a high-level view of how the storage device might affect the overall responsiveness of the system. However, when evaluating different SSDs for use in the same system, there are other factors like power consumption and thermal characteristics. In addition, one of the scenarios not considered by either SYSmark 2014 or PCMark 8 is the transfer of large amounts of data (say, a bunch of photos or videos) from a mass storage device to the primary drive in the system. AnandTech’s DAS (Direct-Attached Storage) Test Suite covers all these aspects.
The Intel NUC6i5SYK doesn’t have a USB 3.1 Gen 2 or Thunderbolt port. Hence, it is difficult, if not, impossible, for an external storage device to keep up with the performance of the PCIe drives inside the system. Therefore, we modified our DAS suite to do the transfer from the primary 120GB partition to the secondary partition of the SSD under test. No RAM drive was set up. The bandwidth and temperature tracking were retained. The test can also reveal whether thermal throttling is triggered due to the transfer of large amounts of data (around 250GB) within a small time window. Before looking at the performance consistency / temperature / bandwidth graphs, let us take a look at the total instantaneous bandwidth numbers for the three different test cases in the DAS test suite.


In terms of raw bandwidth and the time taken to finish copying large amounts of data between partitions, the PCIe 3.0 x4 NVMe SSDs (including the Toshiba OCZ RD400) obviously win big. However, one must also consider how common this use-case is going to be (given that most external storage devices for Skylake-U systems are not going to keep up with PCIe 2.0 x4 AHCI drives, let alone going to PCIe 3.0 x4 NVMe drives).
The graphs below show the temperature and instantaneous bandwidth numbers for the Toshiba OCZ RD400 while processing our DAS test suite. The temperatures are a bit of a concern, with the drive ending up at 68 C at the end of the benchmarking (transfer of more than 250GB of data within a 10 minute duration). Under the same conditions, the Samsung SSD 950 PRO topped out at 59 C.

Power consumption numbers are in line with expectations. The NVMe drives end up making the system consume more power at both load and idle even though they get done with the storage queue faster. That said the OCZ RD400 has the least power consumption amongst all the evaluated NVMe drives.


Concluding Remarks
At the business end of the review, we can clearly see that the Toshiba OCZ RD400 M.2 NVMe SSD is a good choice for use in the Intel Skylake NUCs such as the NUC6i5SYK. The main concern is the thermal characteristics. For systems such as the Intel NUCs and the GIGABYTE BRIX units (with a thermal pad on top of the M.2 SSD), it is not a major concern. However, I would definitely not recommend it for units such as the upcoming ASRock Sylake NUC Beebox series which don’t have the thermal protection for the M.2 SSDs.
Coming back to the Intel NUC6i5SYK and the Toshiba OCZ RD400 – despite providing higher peak performance compared to the Samsung SSD 950 PRO, workloads that demand consistency and low queue-depth performance (typical of workloads for which the Intel NUCs are suitable) end up making the SSD 950 PRO win the battle for the leading benchmark numbers. But, it must be stressed that these differences are hard to spot (for almost all users, even the Kingston HyperX Predator PCIe 2.0 x4 AHCI SSD will be equivalent to the NVMe SSDs in terms of perceived performance).

In the end, it all comes down to aspects such as pricing, warranty and specific requirements. The Toshiba OCZ RD400 is currently the only game in town for a 128GB or 1TB M.2 NVMe SSD. It also appears to have the best warranty terms (with the Advanced Warranty Program providing proactive replacement drives when necessary). The Toshiba OCZ RD400 is available either in solo M.2 form factor (suitable for the Intel NUCs and other similar SFF PCs) or a PCIe add-in card. The former has a current street price of $310, while the latter comes in at $330.