
ASUS Launches ‘Expedition’ Line: GeForce GPUs and Motherboards ‘Built for Non-Stop Gaming’
ASUS has launched five new GPUs and a B150 motherboard that belong to its Expedition family of products. The Expedition video cards promise to wed durability for sustained long-time use with reasonable prices: the boards are made using ASUS’ latest automated production process and feature components with enhanced lifetime ratings over the standard components (albeit with standard cooling and near-reference frequencies). The increased suitability for non-stop use claim comes through the components and additional testing for the range: a combined 144hr compatibility test and burn-in sequence. ASUS plans to market these parts to business such as gaming cafes which remain popular in Asia.
Initially the ASUS Expedition lineup will consist of five graphics adapters based on NVIDIA’s GP104 and GP107 GPUs. The video cards are made using the ASUS Auto-Extreme automated production process that is also used to produce ASUS ROG Strix and some other high-end products. To build the boards, the manufacturer uses dual-ball bearing fans as well as ‘higher-quality’ chokes and other components that are said to be rated for extended durability. ASUS also states that the Expedition graphics cards are stress tested for 144 hours in various demanding environments to ensure their quality. The hardware maker does not elaborate whether all the cards are subject to rigorous testing, or just a number of cards per batch pass those tests, but it emphasizes that the adapters are ready for prolonged gaming sessions. Additionally, similar to its higher-end graphics boards, the Expedition video cards will feature ASUS’ zero-db fans that do not spin until the GPU reaches a certain temperature.
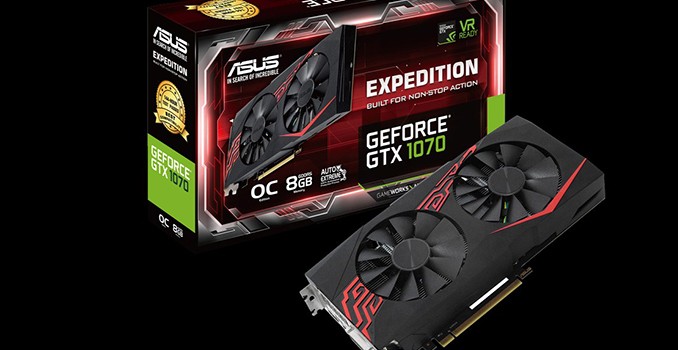
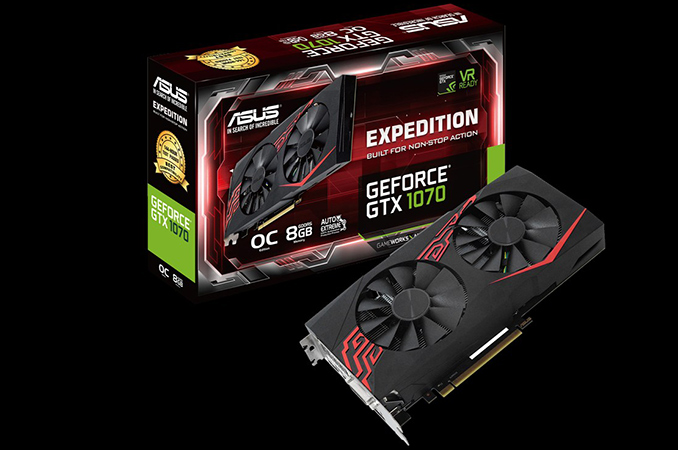
The higher performing card in the lineup is the ASUS Expedition GeForce GTX 1070 OC Edition 8 GB GDDR5 (EX-GTX1070-O8G) that uses the company’s own PCB design (24 cm/9.45” in length) and slightly taller cooling system (13.1 cm/5.16”) with two heat pipes and two fans. It is noteworthy that in default mode its GPU base frequency is 1582 MHz, lower than 1607 MHz recommended by NVIDIA, but the boost clock rate is 1771 MHz, which is higher compared to 1733 MHz on NVDIA’s reference designs. The card also has an OC mode with 1607/1797 MHz base/boost frequencies. As for display outputs, the card has one DVI, two HDMI ports, and two DisplayPort ports.


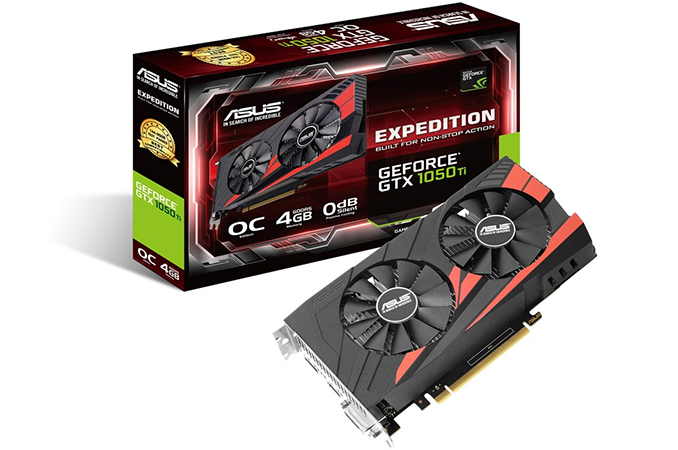
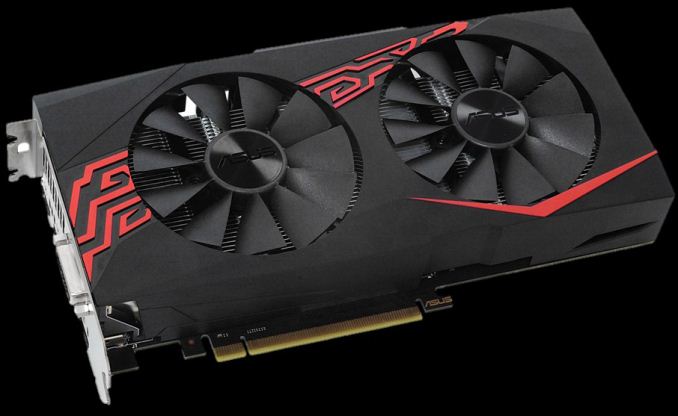
The other two video cards in the Expedition family are the ASUS Expedition GeForce GTX 1050 OC Edition 2 GB (EX-GTX1050-O2G) and the ASUS Expedition GeForce GTX 1050 Ti OC Edition 4 GB (EX-GTX1050TI-O4G), also featuring a custom PCB design and dual-fan cooling systems (in this case, without heat-pipes). Both cards have slightly (~ 50 MHz) higher GPU frequencies than recommended by NVIDIA and thus offer a little bit of improved performance over reference designs. When it comes to the display outputs, these two adapters feature one DVI, one DisplayPort and one HDMI connector. These two cards are paired with non-OC versions (EX-GTX1050-2G and EX-GTX1050TI-4G ) to bring the total up to five.


On the motherboard side, ASUS has listed the EX-B150M-V5 D3 as an addition to the Expedition line. In a somewhat different take on the TUF line (which is aimed at high-end durability), this B150 board is along the similar lines of the GPUs: base hardware with a focus on durability when in a gaming cafe environment.
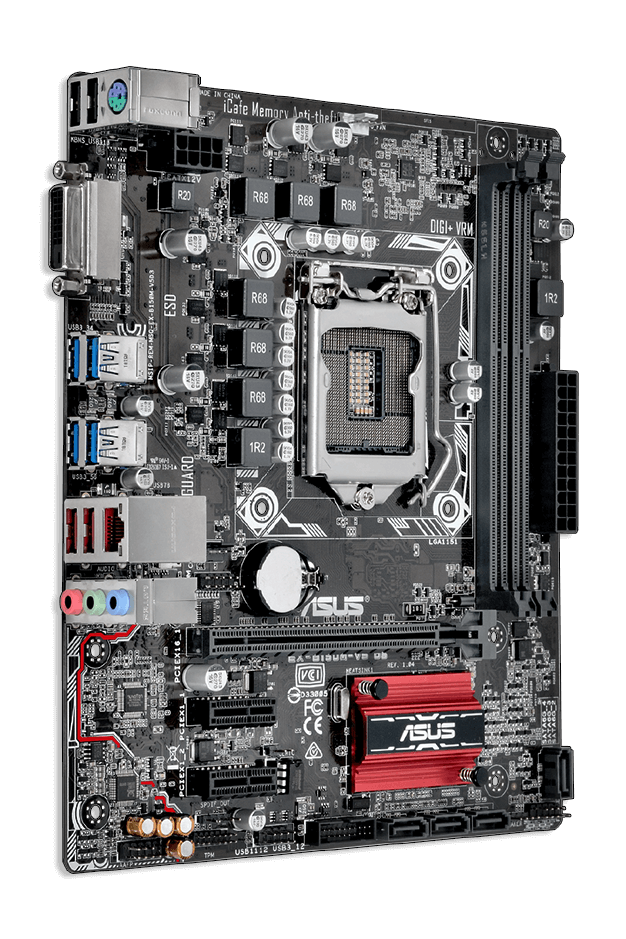
This board caters for most gaming cafe needs: two memory slots, space for a stock cooler, a single GPU slot, 2.1 audio, SATA ports, USB 3.0 ports, and if needed, an integrated graphics based DVI-D port. The Realtek ALC887 (the top 2.1 codec) gets some Crystal Sound 2 treatment via PCB separation and filter caps, and ASUS states that the USB ports are individually surge protected (in case one fails, the others will keep working). As part of the focus on gaming cafes, ASUS states that this board goes through extensive testing to ensure base compatibility with games and 100+ peripherals.
ASUS has not disclosed MSRPs of its Expedition graphics cards or their availability dates, but since the boards are already listed on the company’s website, we expect them to hit the market shortly. However, if they are truly focused on gaming cafes, they might only be launched in Asia. No word yet if these components come with increased warranties, either.
Related Reading: