Microsoft Releases FY 2015 Q3 Financial Results
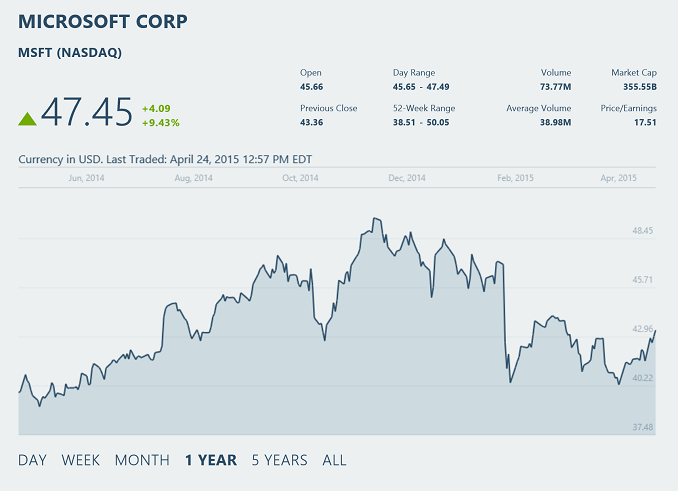
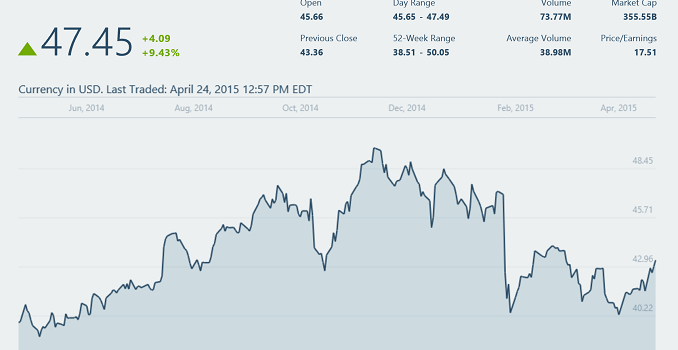
Yesterday (apologies for the delay I was in travel status when the results came out) Microsoft announced their Q3 results for fiscal year 2015, and revenue was up 6% year-over-year, coming in at $21.7 billion for this quarter. Gross margin for the quarter was $14.6 billion, or 67%. Operating income for the quarter was $6.6 billion, down 5% year-over-year, and earnings per share (EPS) was $0.61, down from $0.66 in Q3 2014.
| Microsoft Q3 2015 Financial Results (GAAP) | |||||
| Q3’2015 | Q2’2015 | Q3’2014 | |||
| Revenue (in Billions USD) | $21.729 | $26.470 | $20.403 | ||
| Operating Income (in Billions USD) | $6.594 | $7.776 | $6.974 | ||
| Gross Margin (in Billions USD) | $14.568 | $16.334 | $14.425 | ||
| Margins | 67% | 61.7% | 70.7% | ||
| Basic Earnings per Share (in USD) | $0.61 | $0.71 | $0.68 | ||
Normally Microsoft does not release Non-GAAP measures, but due to the strengthening of the US Dollar over the last year, Microsoft’s earnings were actually weaker than as compared to last year’s exchange rate, so they have provided a comparison to take that into effect. None of the numbers can be used as actual results, but are somewhat interesting to see just how much a global company based in the USA can be impacted negatively by a gain in their home currency. On revenue, the constant currency impact was $534 million, so the year-over-year gain would go from 6% to 9%. Gross margin had a $396 million impact, meaning the comparison to Q3 2014 would show a 4% gain rather than the 1% reported. Operating income was less impacted (my guess is that most of their expenses like salary are in the USA) but there was still an $87 million hit, and EPS took a $0.02 hit based on currency alone.
Some of the loss in operating income was due to the “restructuring” charges of $190 million in relation to the workforce cuts announced last year. This caused a $0.01 hit on earnings per share this quarter. There was also $7.5 billion returned to shareholders this quarter, up 83% over Q3 2014, and consisted of $5 billion in share repurchases and $2.5 billion in dividends. The next dividend payment will be $0.31 per share, payable to shareholders of record as of May 21st and to be paid out on June 11th.
Looking at the individual segments, Microsoft breaks their major divisions down to “Devices and Consumer” and “Commercial” and each segment is further broken down into different segments. These have evolved a bit over time as new products are added to the mix. Devices and Consumer is broken down into Licensing, Computing and Gaming Hardware, Phone Hardware, and Other. Commercial is Licensing and Other. Other includes the cloud computing revenue, so despite the odd name, it is fairly important to Microsoft’s future directions.
On the Devices and Consumer side, Licensing declined 24% year-over-year, with total revenue of $3.48 billion, and gross margin of $3.21 billion. Windows OEM revenue declined 22%, with Pro declining 19% and the Pro licensing returning to pre-Windows XP retirement levels. For those that do not follow this closely, Microsoft (and as a result most PC OEMs) had a surge in sales over the last year due to the end-of-life of XP. Businesses were upgrading at a strong rate which helped sales. Office Consumer revenue declined 41%. This is actually fairly normal, since the company is trying to drive people to Office 365, and the transition to Office 365 contributed to 27 points of the decline, with the remainder being attributed to a weakness in the Japanese PC market where Office has traditionally had a high attach rate. Windows Phone licensing revenue declined 16% due to a higher mix of low royalty devices. I am not sure what Windows Phone licensing entails anymore though since the OS itself was made free to use last year.
Computing and Gaming Hardware had a 4% drop in revenue, coming in at $1.8 billion. Gross margin was $410 million for this segment, which is up 60% (or 92% based on constant currency) and was driven primarily by Surface sales. For the quarter, Surface amounted to $713 million in revenue, which is up 44%, and the Surface 3 was announced which will not be on sale until Q4 (next month) and it opens up Surface with x86 up to different price points. Xbox revenue dropped 24%, and Microsoft has not been able to keep up the post launch numbers from last year. Surface Pro 3 drove the margin improvements.
On the Phone Hardware front, Microsoft sold 8.6 million Lumia smartphones this quarter, which is 18% more than Q3 2014. The Nokia acquisition included the feature phones as well, and Microsoft sold 24.7 million feature phones last quarter which is a market that continues to contract. Revenue for this segment was $1.4 billion, but gross margin was a $61 million loss which is attributed to the currency exchange rates.
Other, which includes online advertising, first party games, and Office 365 Consumer, had a 25% increase in revenue compared to Q3 2014, coming in at $2.2 billion. Gross margin was up 45% to $570 million. Online advertising revenue was up 21% due to higher search volume and revenue per search, and Bing market share in the USA is 20.1%, up 150 basis points. Office 365 Consumer continues its strong gains, with a sequential growth of 35%. Office 365 Consumer now has 12.4 million subscribers. First-Party Games revenue is up 49% driven by Minecraft, which Microsoft acquired last year.
| Microsoft Q3 2015 Segment Overview (in Billions USD) | |||||
| Q3’2015 | Q2’2015 | Q3’2014 | |||
| D&C Licensing Revenue | $3.48 | $4.17 | $4.60 | ||
| D&C Licensing Gross Margin | $3.21 | $3.88 | $4.02 | ||
| D&C Computing and Gaming Hardware Revenue | $1.80 | $4.00 | $1.87 | ||
| D&C Computing and Gaming Hardware Gross Margin | $0.41 | $0.46 | $0.26 | ||
| Phone Hardware Revenue | $1.40 | $2.28 | N/A | ||
| Phone Hardware Gross Margin | -$0.061 | $0.33 | N/A | ||
| D&C Other Revenue | $2.28 | $2.44 | $1.82 | ||
| D&C Other Gross Margin | $0.57 | $0.55 | $0.39 | ||
| Commercial Revenue | $12.80 | $13.27 | $12.24 | ||
| Commercial Gross Margin | $10.42 | $10.83 | $9.91 | ||
On the Commercial segment, revenue was up 5% to $12.8 billion, and gross margin was up 5% to $10.42 billion. The Licensing segment had a revenue decrease of 3%, driven by Office Commercial revenue declining 16%. Windows volume licensing revenue declined 2%, and Server products had a revenue gain of 10%. The Other segment had a revenue gain of 45%, and Commercial Cloud saw another big gain, with revenue growing 106% and Cloud now has an annualized revenue of $6.3 billion. Customer use of Azure more than doubled in the last year. Microsoft has done a good job moving their services to the cloud, and many of their customers are choosing this route. Two out of three new Dynamics CRM customers have went with cloud deployment of the service.
Windows, the once dominant factor in Microsoft’s earnings, continues its decline, but Office has done well to transition to the cloud. Windows Phone is at yet another crossroads, and while sales did increase for the Lumia handsets, they still lag other smartphones by a wide margin. The commercial segments have continued to bring in very high margins, and help offset consumer.
Source: Microsoft Investor Relations